
 Placement Preparation
an HCL GUVI product

Q81
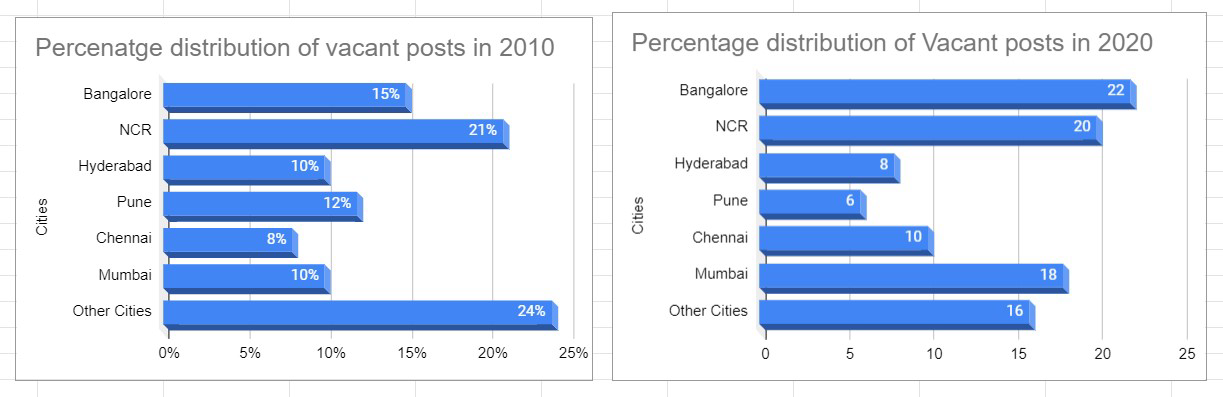
Q81 The percentage arrangement of employment positions in manufacturing industries in 2010 and 2020 is given in the pie chart. In 2010, the total number of vacant posts was 5.4 lakh, and in the year 2020, it was 8.6 lakh.
Calculate the difference between the number of vacant posts available in Bangalore in 2020 and 2010 will be?
1.082 lakh
1.465 lakh
1.124 lakh
1.225 lakh
Q82
Q82 The percentage arrangement of employment positions in manufacturing industries in 2010 and 2020 is given in the pie chart. In 2010, the total number of vacant posts was 5.4 lakh, and in the year 2020, it was 8.6 lakh.
What is the average number of vacant posts available in Hyderabad in the years 2010 and 2020?
72400
64200
61400
82600
Q83
Q83 The percentage arrangement of employment positions in manufacturing industries in 2010 and 2020 is given in the pie chart. In 2010, the total number of vacant posts was 5.4 lakh, and in the year 2020, it was 8.6 lakh.
The total number of vacant posts available in Chennai in 2010 and Mumbai in 2020 is?
118200
126200
136400
129200
Q84
Q84 The percentage arrangement of employment positions in manufacturing industries in 2010 and 2020 is given in the pie chart. In 2010, the total number of vacant posts was 5.4 lakh, and in the year 2020, it was 8.6 lakh.
Suppose the number of vacant posts in Pune is 48000 in 2020 and the percentage distribution is the same as shown in the chart, then the number of vacant posts available in NCR in 2020 will be?
1.732 lakh
1.488 lakh
1.334 lakh
1.557 lakh
Q85
Q85 The percentage arrangement of employment positions in manufacturing industries in 2010 and 2020 is given in the pie chart. In 2010, the total number of vacant posts was 5.4 lakh, and in the year 2020, it was 8.6 lakh.
The percentage rise in vacant posts available in Hyderabad from the year 2010 to 2020 approximately is?
27.41%
28.35%
22.75%
26.56%
Q86
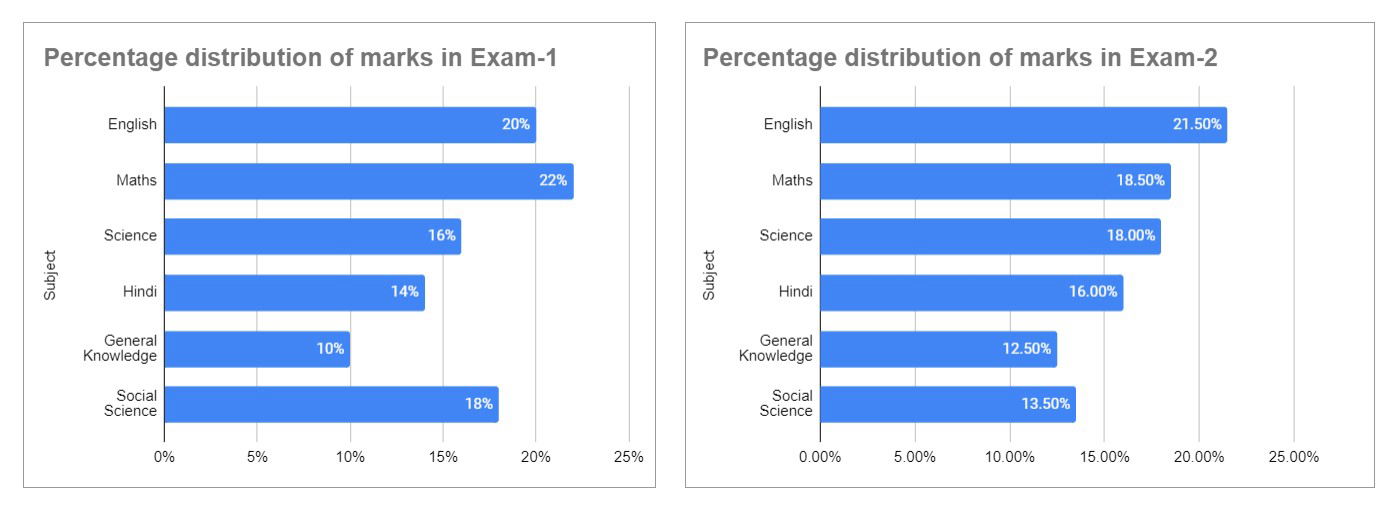
Q86 Given chart depicts the percentage distribution of marks scored by a student in Exam-1 and Exam-2. In Exam-1 he got 750 marks and in Exam-2 he got 800.
The total marks scored by the student in Maths, Science and English together in Exam-2 will be?
448
464
562
786
Q87
Q87 Given chart depicts the percentage distribution of marks scored by a student in Exam-1 and Exam-2. In Exam-1 he got 750 marks and in Exam-2 he got 800.
The difference in marks scored by him in Science in Exam-2 and that in Social Science in Exam-1?
4
14
7
9
Q88
Q88 Given chart depicts the percentage distribution of marks scored by a student in Exam-1 and Exam-2. In Exam-1 he got 750 marks and in Exam-2 he got 800.
The percentage increase in marks scored by him in General Knowledge, from Exam–1 to Exam–2?
25.50%%
32%
50%
33.33%
Q89
Q89 Given chart depicts the percentage distribution of marks scored by a student in Exam-1 and Exam-2. In Exam-1 he got 750 marks and in Exam-2 he got 800.
The marks scored by the student in Social Science in Exam–2 is what percentage of the marks scored by him in the same subject in Exam–1?
80%
75%
65%
None of the above
Q90
Q90 Given chart depicts the percentage distribution of marks scored by a student in Exam-1 and Exam-2. In Exam-1 he got 750 marks and in Exam-2 he got 800.
The marks scored by the student in Science in both exams together is what percentage more than the marks scored by him in Hindi in both exams together?
74.6%
98.5%
88%
65.8%
