
 Placement Preparation
an HCL GUVI product

Q41
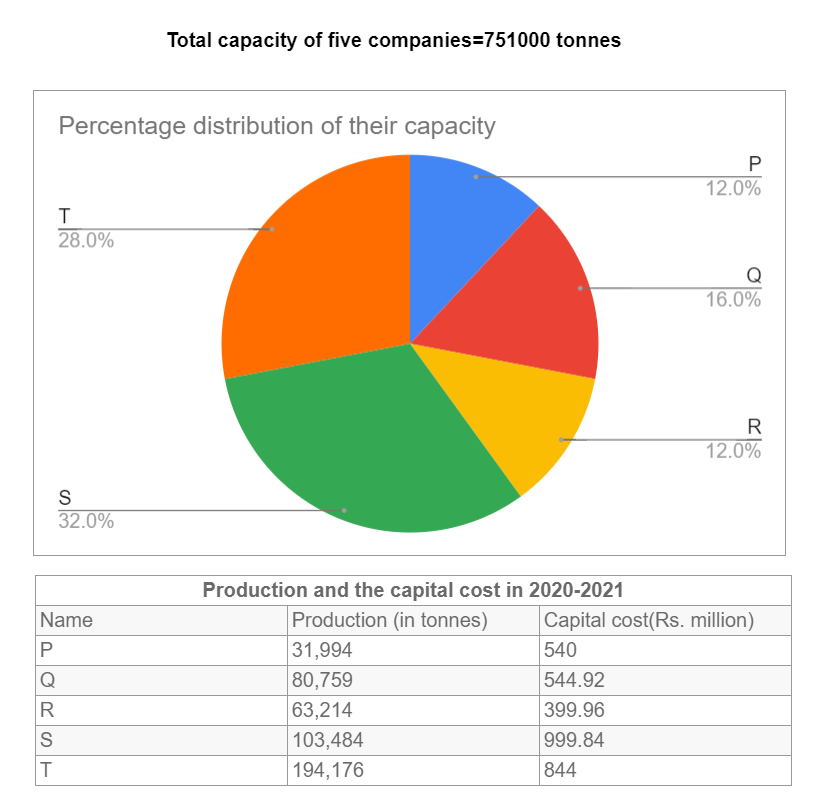
Q41 Go through the pie chart and the table given and answer the following question.
The highest capacity utilization is shown by which of the following companies?
P
S
R
T
Q42
Q42 Go through the pie chart and the table given and answer the following question.
Which company had shown the lowest capital cost per tonne of capacity?
P
T
Q
S
Q43
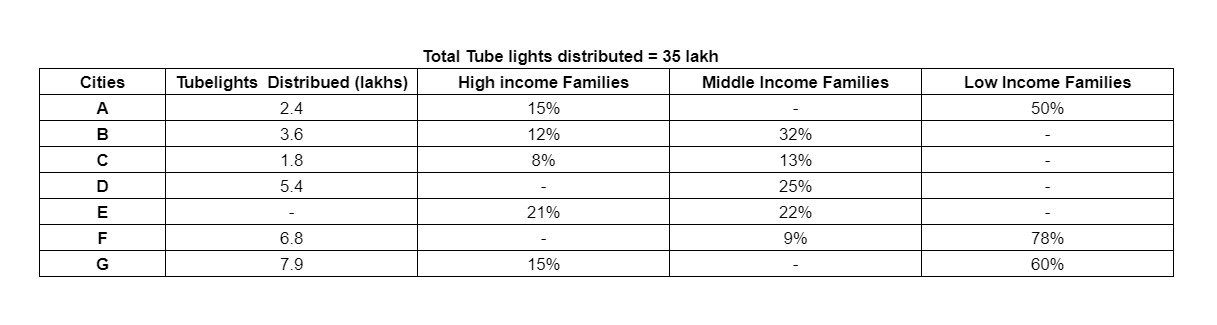
Q43 Following is the table is given for tube light distribution for five different cities. Read the table carefully and answer the following question.
What is the difference between tube light distribution in higher-income families of C,E, and F together and the middle-income families of A, B, and G together?
1.569 lakhs
1.448 lakhs
1.86 lakhs
2.245 lakhs
Q44
Q44 Following is the table is given for tube light distribution for five different cities. Read the table carefully and answer the following question.
Total distribution of tube light in low-income families of all the cities together, excluding D, is approximately what percent of the entire distribution of tube light in all cities?
62.62%
66.93%
67.50%
71.25%
Q45
Q45 Following is the table is given for tube light distribution for five different cities. Read the table carefully and answer the following question.
In city D, if the ratio of the distribution of tube light in high-income families to the low-income families is 8:7, then the distribution of tube light in higher-income families in the same city is how much more than that of low-income families?
0.18 lakhs
1.12 lakhs
0.27 lakhs
0.54 lakhs
Q46
Q46 Following is the table is given for tube light distribution for five different cities. Read the table carefully and answer the following question
Total distribution of tube light in city E is what percentage more or less than that of entire distribution of tube lights in cities D and C both?
1.33% less
1.39% less
1.43% more
1.72% more
Q47
Q47 Following is the table is given for tube light distribution for five different cities. Read the table carefully and answer the following question.
What is the ratio of the distribution of tube light in the low-income families of city C to the middle-income families of city G?
0.86:1
0.76:1
1.12:1
0.72:1
Q48
Q48 Go through the pie chart and the table given and answer the following question.
Find out the total capacity in the country, assuming that the presented capacity of the five companies accounts for 87% of the total capacity in the country.
863218 tonnes
852634 tonnes
786451 tonnes
879543 tonnes
Q49
Q49 Go through the pie chart and the table given and answer the following question.
Calculate the capacity utilization of the company that has the highest capacity?
82.75%
71.68%
95.68%
92.34%
Q50
Q50 Go through the pie chart and the table given and answer the following question.
Calculate the average capacity utilization of the five companies in 2020-21?
58.92%
66.67%
61.65%
74.35%
