
 Placement Preparation
an HCL GUVI product

Q91
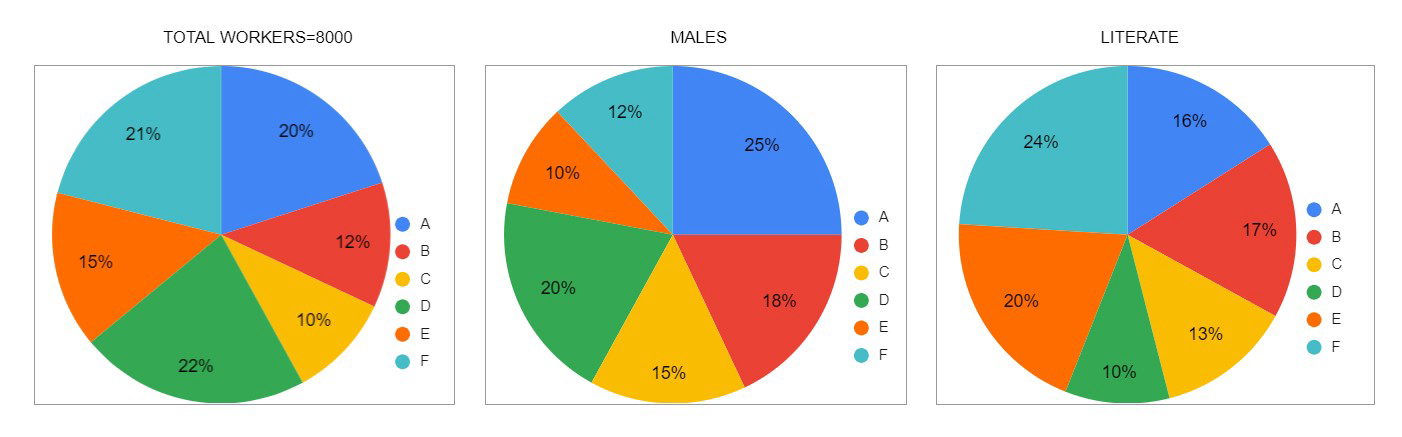
Q91 The total number of workers of a factory is 8000 having the ratio of male to female 3 : 5 and literate to illiterate 3 : 2. Given figure shows the percentage distribution of these workers among different divisions.
The number of workers working in the division F who are illiterate is?
3648
3872
4246
3275
Q92
Q92 The total number of workers of a factory is 8000 having the ratio of male to female 3 : 5 and literate to illiterate 3 : 2. Given figure shows the percentage distribution of these workers among different divisions.
The total number of male literate workers working in division D are?
960
1080
1120
None of these
Q93
Q93 The total number of workers of a factory is 8000 having the ratio of male to female 3 : 5 and literate to illiterate 3 : 2. Given figure shows the percentage distribution of these workers among different divisions.
The difference between the total number of female workers and the total number of male workers working in the factory?
3000
2000
1800
2500
Q94
Q94 The total number of workers of a factory is 8000 having the ratio of male to female 3 : 5 and literate to illiterate 3 : 2. Given figure shows the percentage distribution of these workers among different divisions.
The number of literate workers working in division C is what percentage of the number of illiterate workers working in division E?
120%
260%
80%
180%
Q95
Q95 The total number of workers of a factory is 8000 having the ratio of male to female 3 : 5 and literate to illiterate 3 : 2. Given figure shows the percentage distribution of these workers among different divisions.
The total number of female workers in division F is what percentage more than the total number of male workers working in division A?
76%
84%
72%
64%
Q96
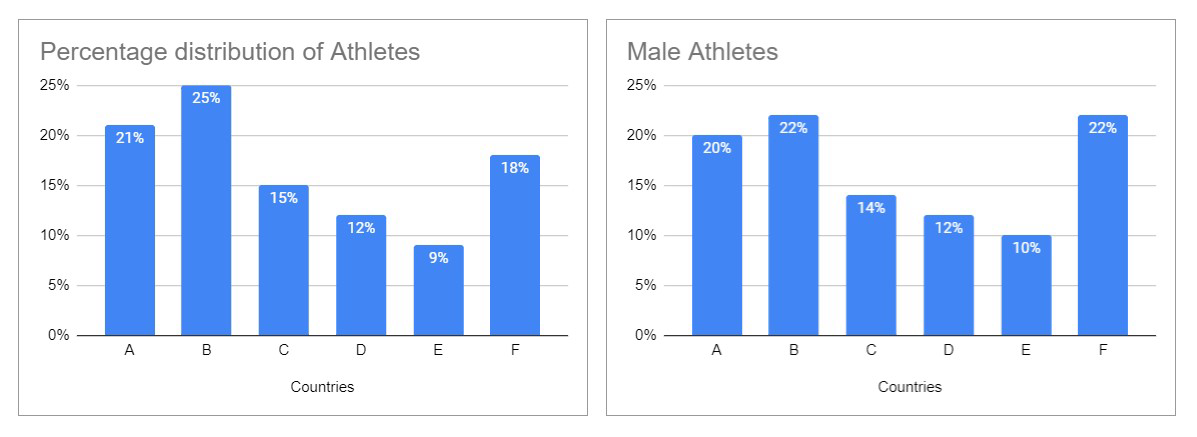
Q96 Following figure displays the percentage distribution of athletes on the basis of their nations. Total number of athletes who competed in the event is 2200 and the ratio of Male to Female among them is 15:7.
The total Female athletes from Country D is what percentage of the total Male athletes from Country A?
225.67%
243.67%
255%
233.33%
Q97
Q97 Following figure displays the percentage distribution of athletes on the basis of their nations. Total number of athletes who competed in the event is 2200 and the ratio of Male to Female among them is 15:7.
The total male athletes from Country B and F together is what percentage of the total athletes of the event?
33%
25%
30%
35%
Q98
Q98 Following figure displays the percentage distribution of athletes on the basis of their nations. Total number of athletes who competed in the event is 2200 and the ratio of Male to Female among them is 15:7.
The male athletes from Country E are what percentage more than the Female athletes from Country C?
63%
66.67%
74.25%
71.33%
Q99
Q99 Following figure displays the percentage distribution of athletes on the basis of their nations. Total number of athletes who competed in the event is 2200 and the ratio of Male to Female among them is 15:7.
The ratio of the total athletes from country D to the total female athletes from Country E is?
1.33 : 1
2.4 : 1
3 : 4
4 : 3
Q100
Q100 Following figure displays the percentage distribution of athletes on the basis of their nations. Total number of athletes who competed in the event is 2200 and the ratio of Male to Female among them is 15:7.
Suppose 20 additional female athletes from Country C compete in the event, the total number of female athletes from Country C is what percentage of total athletes from Country C?
52.25%
33.33%
65.56%
45.45%
