
 Placement Preparation
an HCL GUVI product

Q121
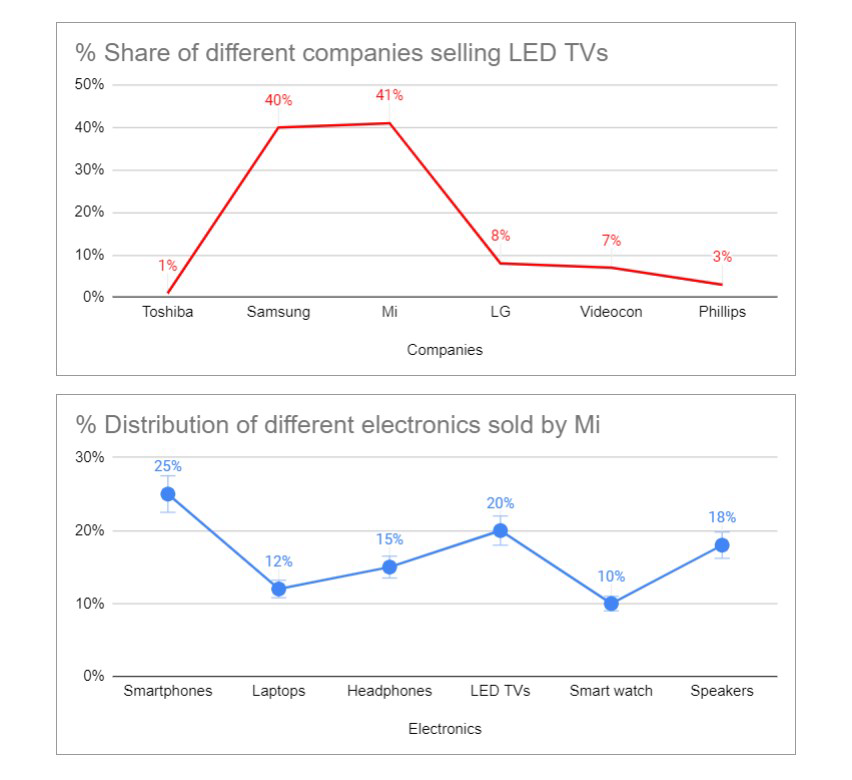
Q121 Percentage share of the sales of LED TVs by six different companies in the financial year 2019-20 is displayed in the chart below. Observe the given charts carefully and then answer the question-
If the number of LED TVs sold by Samsung is 40000 in the financial year 2018-19 and the percentage rise in the sales of LED TVs is 12.5 % in the financial year 2019-20 then how many units have been sold by LG in FY 2019 -20?
12800
7200
9000
8500
Q122
Q122 Percentage share of the sales of LED TVs by six different companies in the financial year 2019-20 is displayed in the chart below. Observe the given charts carefully and then answer the question-
What is the approximate percentage of LED TVs sold by Videocon with respect to that of Laptops sold by Mi in the financial year 2019-20, if the number of units sold by Phillips is 3375?
34.75%
42.75%
18.67%
28.45%
Q123
Q123 Percentage share of the sales of LED TVs by six different companies in the financial year 2019-20 is displayed in the chart below. Observe the given charts carefully and then answer the question-
What is the ratio of the number of LG LED TVs sold to the number of Laptops sold by Mi in the year 2019-20?
0.245:1
0.325:1
0.436:1
0.565:1
Q124
Q124 Percentage share of the sales of LED TVs by six different companies in the financial year 2019-20 is displayed in the chart below. Observe the given charts carefully and then answer the question-
What is the approximate percentage of Phillips LED TVs sold to that of Speakers sold by Mi in 2019-20?
11.37%
14.54%
12.19%
17.67%
Q125
Q125 Percentage share of the sales of LED TVs by six different companies in the financial year 2019-20 is displayed in the chart below. Observe the given charts carefully and then answer the question-
As per the data given, what is the average percentage of units of Phillips, Videocon, LG and Toshiba LED TVs sold in the financial year 2019-20?
4.75%
5.25%
4.25%
6.55%
Q126
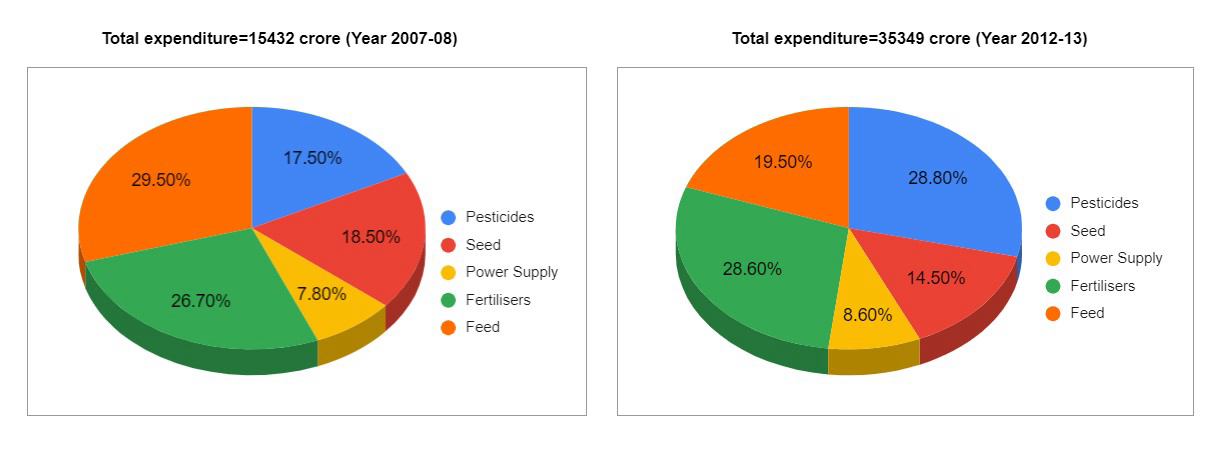
Q126 The given charts display the major expenditures in agriculture under different domains in financial years 2007- 08 and 2012-13. Observe the given charts carefully and then answer the following question-
The total expenditures on power supply in the year 2012-13 exceeded similar expenditure in the year 2007-08 by approximately?
1746 crore
1836 crore
1672 crore
1954 crore
Q127
Q127 The given charts display the major expenditures in agriculture under different domains in financial years 2007- 08 and 2012-13. Observe the given charts carefully and then answer the following question-
The actual expenditure on pesticides in year 2012-13 exceeded the expenditure on the same in year 2007-08 by approximately what percentage?
247%
252%
312%
277%
Q128
Q128 The given charts display the major expenditures in agriculture under different domains in financial years 2007- 08 and 2012-13. Observe the given charts carefully and then answer the following question-
What amount of expenditure was done on pesticides and feed together in the year 2007-08?
6743 crore
6969 crore
7253 crore
8293 crore
Q129
Q129 The given charts display the major expenditures in agriculture under different domains in financial years 2007- 08 and 2012-13. Observe the given charts carefully and then answer the following question-
What amount of expenditure on fertilizers was increased in year 2012-13 in comparison to that in year 2007-08?
5990 crore
6485 crore
7218 crore
5448 crore
Q130
Q130 The given charts display the major expenditures in agriculture under different domains in financial years 2007- 08 and 2012-13. Observe the given charts carefully and then answer the following question-
What amount of expenditure on feed was increased in year 2012-13 in comparison to that in year 2007-08?
2227 crore
1989 crore
2341 crore
2448 crore
