
 Placement Preparation
an HCL GUVI product

Q21
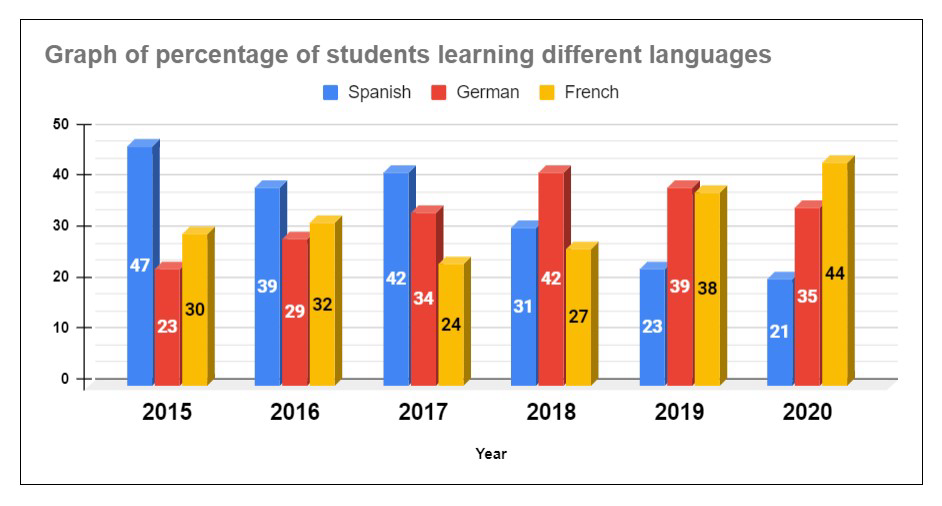
Q21 Given chart shows the percentage of class 10 students of a school learning a language among French, German and Spanish. The data is given for the years 2015-2020.
If a total of 2262 students learnt Spanish in the year 2016 then what will be the total number of students in that year?
5450
6400
5800
None of the above
Q22
Q22 Given chart shows the percentage of class 10 students of a school learning a language among French, German and Spanish. The data is given for the years 2015-2020.
If the number of students learnt German in the year 2015 were 1265 then find the number of students who learnt Spanish in that year?
2348
1786
2475
2585
Q23
Q23 Given chart shows the percentage of class 10 students of a school learning a language among French, German and Spanish. The data is given for the years 2015-2020.
If sum of the number of students who learnt french in 2017 and 2019 is 3958 and the total no of students in 2019 is 300 more than the total number of students in 2017, then find the total students in these 2 years.
12700
13400
12900
None of the above
Q24
Q24 Given chart shows the percentage of class 10 students of a school learning a language among French, German and Spanish. The data is given for the years 2015-2020.
If the total students in 2018 is 5900 then find the ratio of difference between the number of French students and Spanish students in 2018 to the sum of the same in 2018.
Q25
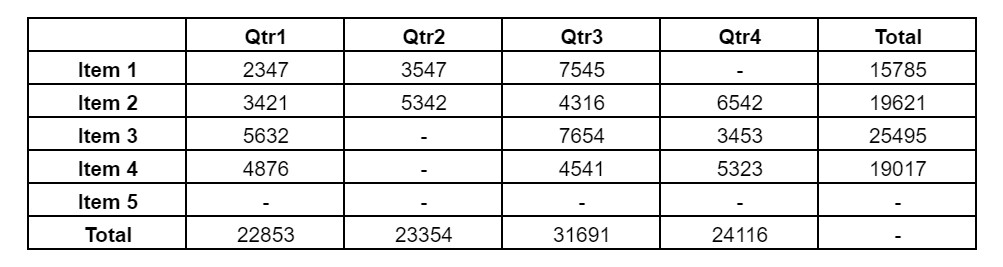
Q25 The following table shows the data of sales of five different items during different quarters in the year 2018. Some of the data from the table is missing.
The percentage of Item 5 sold in Qtr1 is what percentage of Item 5 sold in Qtr 4?
99.84%
108.67%
101.94%
103.86%
Q26
Q26 The following table shows the data of sales of five different items during different quarters in the year 2018. Some of the data from the table is missing.
Find the ratio of quantity of item 4 sold in qtr 2 to the quantity of item 1 sold in qtr 4?
1.43:1
1.82:1
2.31:1
1.64:1
Q27
Q27 The following table shows the data of sales of five different items during different quarters in the year 2018. Some of the data from the table is missing.
Find the total quantity of item 5 sold in the whole year?
22096
23867
21864
22937
Q28
Q28 Given chart shows the percentage of class 10 students of a school learning a language among French, German and Spanish. The data is given for the years 2015-2020.
Find the average percentage of students who learnt Spanish in all these years?
34..0%
33.83%
32.76%
38.33%
Q29
Q29 The following table shows the data of sales of five different items during different quarters in the year 2018. Some of the data from the table is missing.
What is the average total quantity of all types of items sold per quarter?
23450.8
25503.5
27348.9
21423.6
24987.2
Q30
Q30 The following table shows the data of sales of five different items during different quarters in the year 2018. Some of the data from the table is missing.
What percentage of quantity of items were sold in qtr 1 in comparison to the whole year?
24.75%
25.62%
21.83%
22.40%
