
 Placement Preparation
an HCL GUVI product

Q161
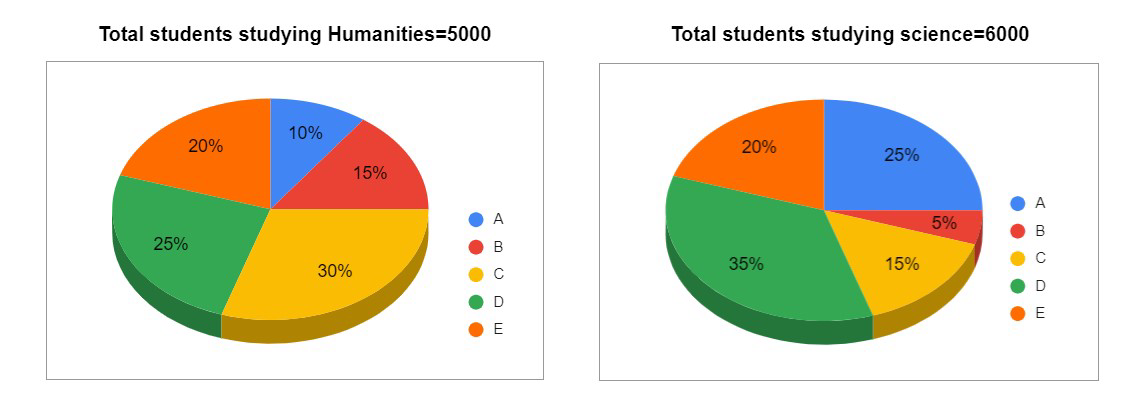
Q161 The given charts display the distribution of candidates studying Science and Humanities in five different Institutions A, B, C, D and E.
What is the number of candidates studying Humanities and Science in Institute D and E together?
4840
5120
5550
5860
Q162
Q162 The given charts display the distribution of candidates studying Science and Humanities in five different Institutions A, B, C, D and E.
What is the ratio of the number of students studying Humanities in Institute D to that studying Science in Institute C?
1.48:1
1.39:1
2.88:1
1.87:1
Q163
Q163 The given charts display the distribution of candidates studying Science and Humanities in five different Institutions A, B, C, D and E.
The total number of students studying both Science and Humanities in Institute B and E together is what percent of the total number of students studying Humanities?
75%
65%
85%
70%
Q164
Q164 The given charts display the distribution of candidates studying Science and Humanities in five different Institutions A, B, C, D and E.
The number of students studying Humanities in Institute A is approximately what percent of the total number of students studying Science in Institute B?
154.33%
187.67%
175.83%
166.67%
Q165
Q165 The given charts display the distribution of candidates studying Science and Humanities in five different Institutions A, B, C, D and E.
What is the ratio of the total number of students studying Humanities in Institute C to that studying Science in Institute A and E together?
0.72:1
0.45:1
0.55:1
0.67:1
Q166
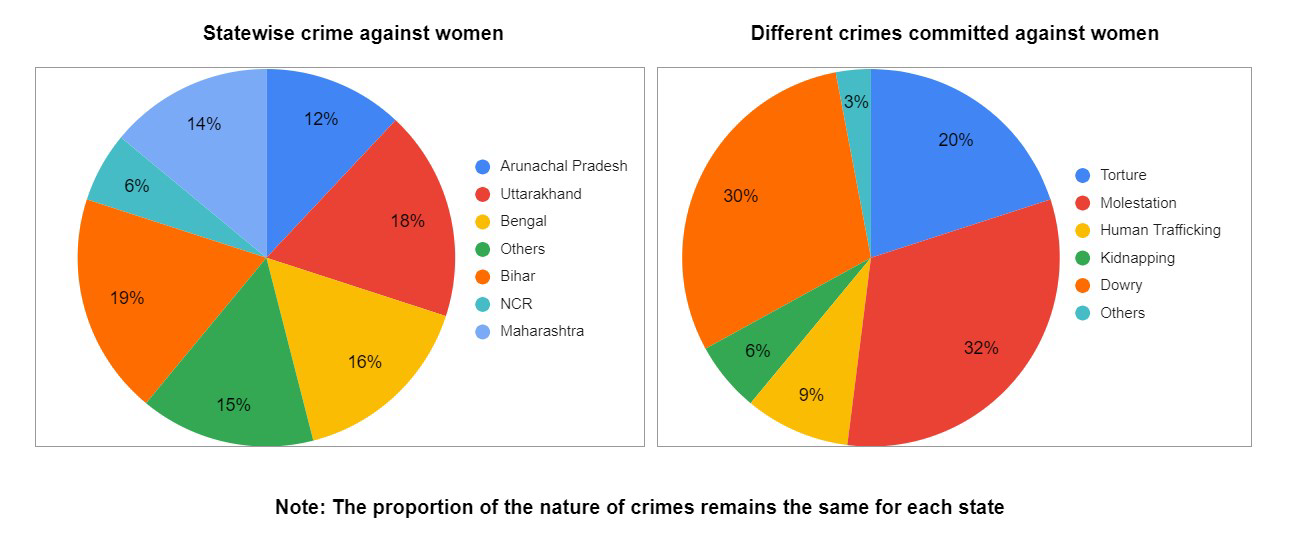
Q166 The given charts display the crimes against females in the year 2015. If the total number of police cases filed as crimes against women in 2015 is 10 lakh then answer the following question-
What is the approximate number of cases of Torture that were filed per day in Maharashtra in the year 2015?
48
57
77
64
Q167
Q167 The given charts display the crimes against females in the year 2015. If the total number of police cases filed as crimes against women in 2015 is 10 lakh then answer the following question-
In 2015, the number of filed police cases in Bangla and Maharashtra together exceeded the number of filed cases in Arunachal Pradesh and Others together by?
50000
45000
42000
52500
Q168
Q168 The given charts display the crimes against females in the year 2015. If the total number of police cases filed as crimes against women in 2015 is 10 lakh then answer the following question-
What is the percentage of crimes filed in Bihar with respect to the number of cases in NCR?
325.45%
316.67%
283.67%
295.33%
Q169
Q169 The given charts display the crimes against females in the year 2015. If the total number of police cases filed as crimes against women in 2015 is 10 lakh then answer the following question-
The difference in the number of cases of Kidnapping filed in Uttarakhand to that in Bangla is?
960
1140
1100
1200
Q170
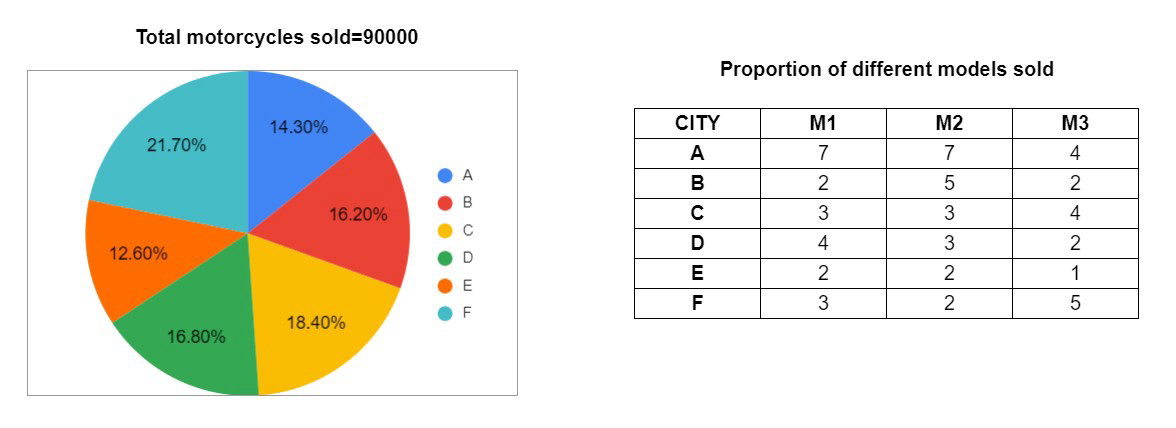
Q170 The given chart displays the distribution of the motorcycles sold by a motorcycle manufacturing company in six different cities. The table shows the proportion of three different models among those motorcycles.If the total number of motorcycles sold by the company in six cities is 90000 then answer the following-
What is the total number of motorcycles of model M2 sold in all six cities together?
31555
36484
34756
28495
