
 Placement Preparation
an HCL GUVI product

Q171
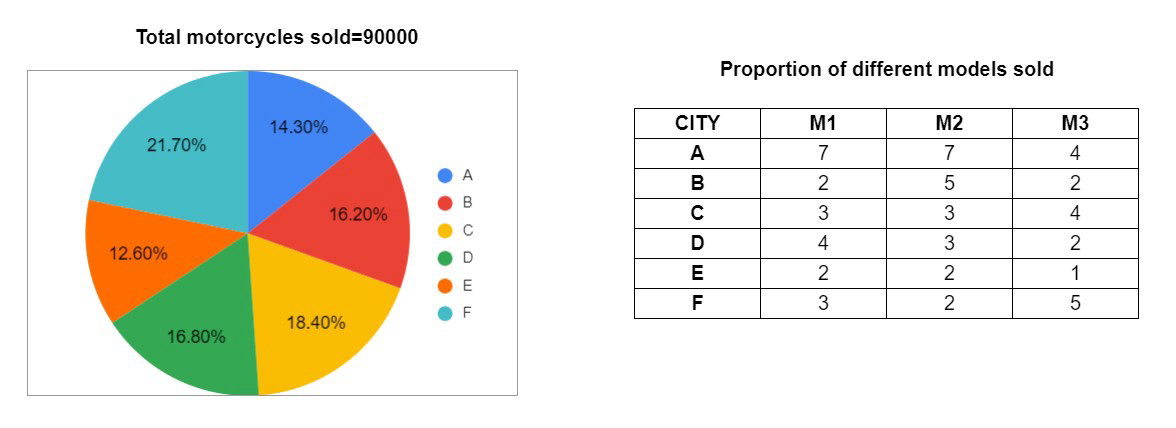
Q171 The given chart displays the distribution of the motorcycles sold by a motorcycle manufacturing company in six different cities. The table shows the proportion of three different models among those motorcycles.If the total number of motorcycles sold by the company in six cities is 90000 then answer the following-
What is the difference between motorcycles of model M1 sold in City D and City E?
2275
2184
2882
1975
Q172
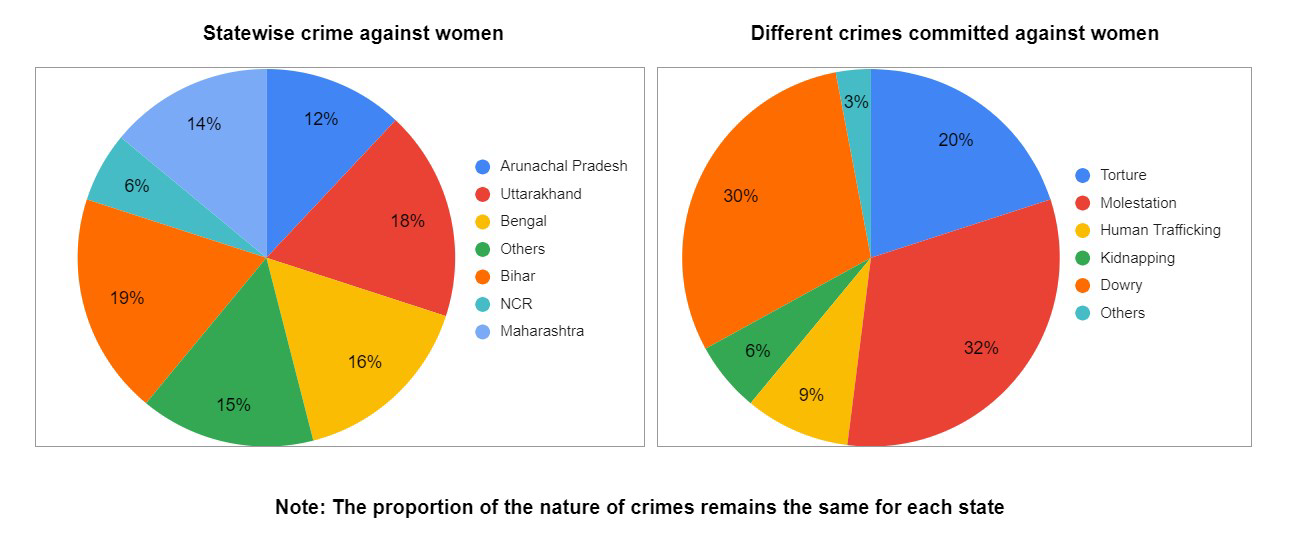
Q172 The given charts display the crimes against females in the year 2015. If the total number of police cases filed as crimes against women in 2015 is 10 lakh then answer the following question-
The difference in the number of cases of Molestation and Others together with the number of cases of Dowry is?
62000
58000
50000
45000
Q173
Q173 The given chart displays the distribution of the motorcycles sold by a motorcycle manufacturing company in six different cities. The table shows the proportion of three different models among those motorcycles.If the total number of motorcycles sold by the company in six cities is 90000 then answer the following-
The number of motorcycles of model M1 sold in City D is approximately what percentage of the total number of motorcycles of model M2 sold in City A?
134%
121%
156%
129%
Q174
Q174 The given chart displays the distribution of the motorcycles sold by a motorcycle manufacturing company in six different cities. The table shows the proportion of three different models among those motorcycles.If the total number of motorcycles sold by the company in six cities is 90000 then answer the following-
Total number of motorcycles sold in City F is approximately what percentage more or less than the total number of motorcycles sold in City B?
128%
144%
134%
152%
Q175
Q175 The given chart displays the distribution of the motorcycles sold by a motorcycle manufacturing company in six different cities. The table shows the proportion of three different models among those motorcycles.If the total number of motorcycles sold by the company in six cities is 90000 then answer the following-
What is the ratio of the total number of motorcycles sold in City C to the total number of motorcycles of model M2 sold in City D?
2.36:1
4.36:1
4.21:1
3.28:1
Q176
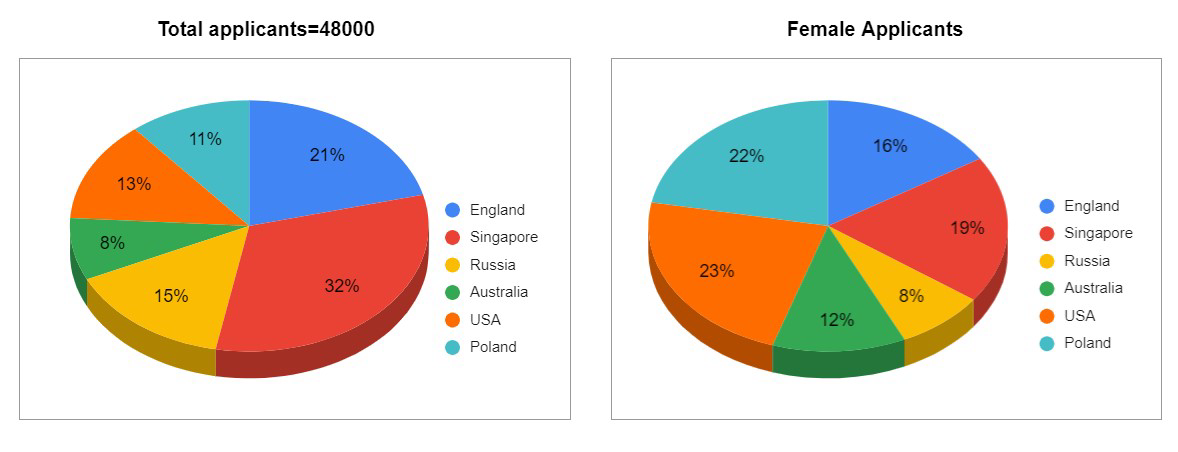
Q176 The given chart displays the distribution of people who have applied for Visa for different countries and the second chart displays the distribution of females who have applied for the visa for these countries. If the ratio of male applicants to the female is 5:3 then answer the following question-
The ratio of the number of Visa applicants for USA and England together to the Visa applicants for Singapore and Poland will be?
0.43:1
0.69:1
0.79:1
0.88:1
Q177
Q177 The given chart displays the distribution of people who have applied for Visa for different countries and the second chart displays the distribution of females who have applied for the visa for these countries. If the ratio of male applicants to the female is 5:3 then answer the following question-
For how many countries out of these six, the number of female Visa applicants is more than the number of male Visa applicants?
three
two
one
none of these
Q178
Q178 The given chart displays the distribution of people who have applied for Visa for different countries and the second chart displays the distribution of females who have applied for the visa for these countries. If the ratio of male applicants to the female is 5:3 then answer the following question-
What will be the ratio of male Visa applicants for Australia and Russia together to the female Visa applicants for England and USA together?
1.01:1
0.88:1
1.06:1
1.21:1
Q179
Q179 The given chart displays the distribution of people who have applied for Visa for different countries and the second chart displays the distribution of females who have applied for the visa for these countries. If the ratio of male applicants to the female is 5:3 then answer the following question-
For which country out of these six, the number of male Visa applicants is minimum?
Singapore
USA
Russia
Poland
Q180
Q180 The given chart displays the distribution of people who have applied for Visa for different countries and the second chart displays the distribution of females who have applied for the visa for these countries. If the ratio of male applicants to the female is 5:3 then answer the following question-
The difference between the female Visa applicants for the countries Australia and Poland will be?
1575
1800
1990
1760
