
 Placement Preparation
an HCL GUVI product

Q181
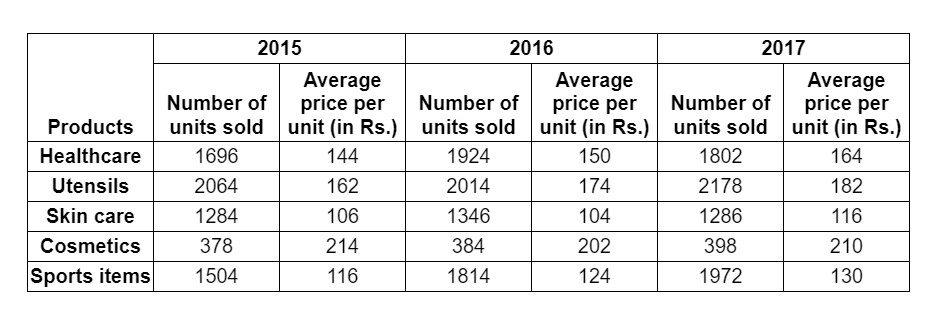
Q181 The given table displays the data of different products sold by a company and their average price for each product of three different years 2015, 2016 and 2017. Read the table carefully and answer the question-
In 2015, what percentage of sales (by value) of Skin care products took place out of the all the products?
12.67%
14.03%
17.16%
19.98%
Q182
Q182 The given table displays the data of different products sold by a company and their average price for each product of three different years 2015, 2016 and 2017. Read the table carefully and answer the question-
For how many products did the average price per unit increased by more than 15% from 2015 to 2017?
4
2
1
None of these
Q183
Q183 The given table displays the data of different products sold by a company and their average price for each product of three different years 2015, 2016 and 2017. Read the table carefully and answer the question-
Which product has the highest increase in the average unit per price from 2015 to 2017?
Healthcare
Skincare
Utensils
None of these
Q184
Q184 The given table displays the data of different products sold by a company and their average price for each product of three different years 2015, 2016 and 2017. Read the table carefully and answer the question-
Which of the products has the lowest percentage increase in sales (by value) from 2015 to 2016?
Healthcare
Skincare
Cosmetics
None of these
Q185
Q185 The given table displays the data of different products sold by a company and their average price for each product of three different years 2015, 2016 and 2017. Read the table carefully and answer the question-
Which of the products has the highest percentage increase in sales (by value) from 2015 to 2016?
Healthcare
Sports items
Cosmetics
None of these
Q186
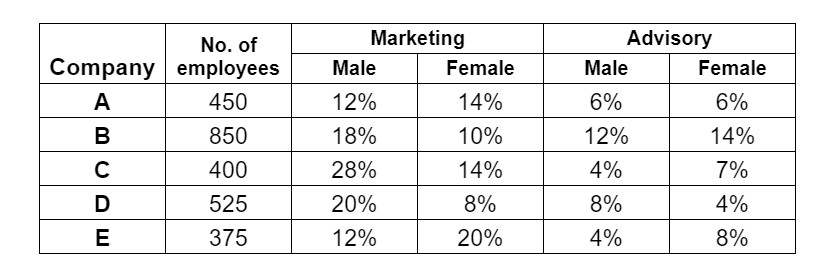
Q186 The given table shows the data of employees of five companies A, B, C, D and E in Marketing and Advisory departments.It also displays the percentage of male and female employees in Marketing and Advisory departments with respect to the total number of employees. Read the table carefully and answer the question given below-
What will be the ratio of female employees in Marketing department of company D and E together to the male employees of Advisory department in Company A and B together?
0.75:1
0.67:1
0.9:1
1.2:1
Q187
Q187 The given table shows the data of employees of five companies A, B, C, D and E in Marketing and Advisory departments.It also displays the percentage of male and female employees in Marketing and Advisory departments with respect to the total number of employees. Read the table carefully and answer the question given below-
What is the difference between the male employees of the Advisory department in all companies together and the female employees of the Marketing department of all companies together?
119
127
113
129
Q188
Q188 The given table shows the data of employees of five companies A, B, C, D and E in Marketing and Advisory departments.It also displays the percentage of male and female employees in Marketing and Advisory departments with respect to the total number of employees. Read the table carefully and answer the question given below-
The total number of Advisory employees of company B and D is what percent more or less than the total number of employees in company C?
36%
63%
57%
71%
Q189
Q189 The given table shows the data of employees of five companies A, B, C, D and E in Marketing and Advisory departments.It also displays the percentage of male and female employees in Marketing and Advisory departments with respect to the total number of employees. Read the table carefully and answer the question given below-
Which company has the highest number of female employees in both departments together?
A
C
B
None of these
Q190
Q190 The given table shows the data of employees of five companies A, B, C, D and E in Marketing and Advisory departments.It also displays the percentage of male and female employees in Marketing and Advisory departments with respect to the total number of employees. Read the table carefully and answer the question given below-
Which company has the lowest number of female employees in both departments together?
A
E
B
None of these
