
 Placement Preparation
an HCL GUVI product

Q101
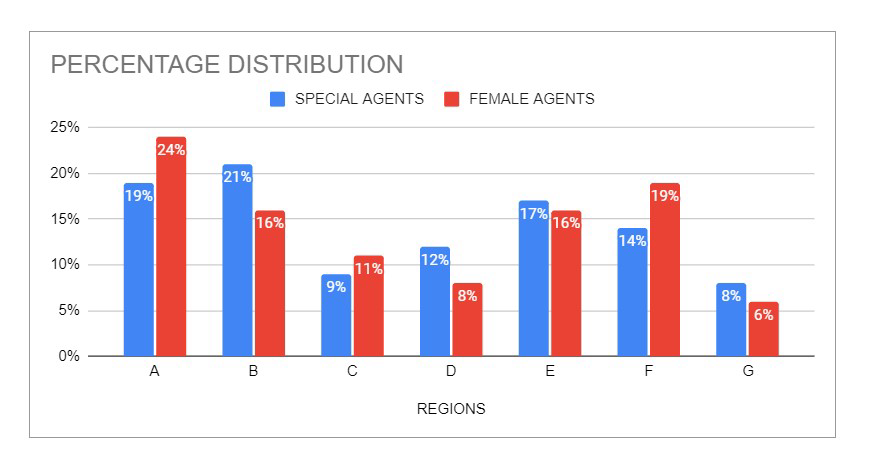
Q101 The given chart displays the percentage distribution of special agents from different regions and the percentage distribution of female special agents among them. Total agents in all seven regions together is 4800 and the ratio of male to female among them is 5 : 3.
The number of regions in which the number of female special agents is more than the average number of female special agents (taking all regions together) are?
3
2
1
4
Q102
Q102 The given chart displays the percentage distribution of special agents from different regions and the percentage distribution of female special agents among them. Total agents in all seven regions together is 4800 and the ratio of male to female among them is 5 : 3.
The number of regions in which the number of male special agents is less than the number of female special agents are?
0
1
3
2
Q103
Q103 The given chart displays the percentage distribution of special agents from different regions and the percentage distribution of female special agents among them. Total agents in all seven regions together is 4800 and the ratio of male to female among them is 5 : 3.
In Region A the number of female special agents is what percentage of the number of male special agents?
64%
85%
90%
78%
Q104
Q104 The given chart displays the percentage distribution of special agents from different regions and the percentage distribution of female special agents among them. Total agents in all seven regions together is 4800 and the ratio of male to female among them is 5 : 3.
The difference between the average number of male agents of regions A, B and C together and the average number of male agents of City E, F and G together?
100
84
72
64
Q105
Q105 The given chart displays the percentage distribution of special agents from different regions and the percentage distribution of female special agents among them. Total agents in all seven regions together is 4800 and the ratio of male to female among them is 5 : 3.
The total number of female special agents in City D is what percentage of the total number of male special agents in City B?
45%
33%
30%
25%
Q106
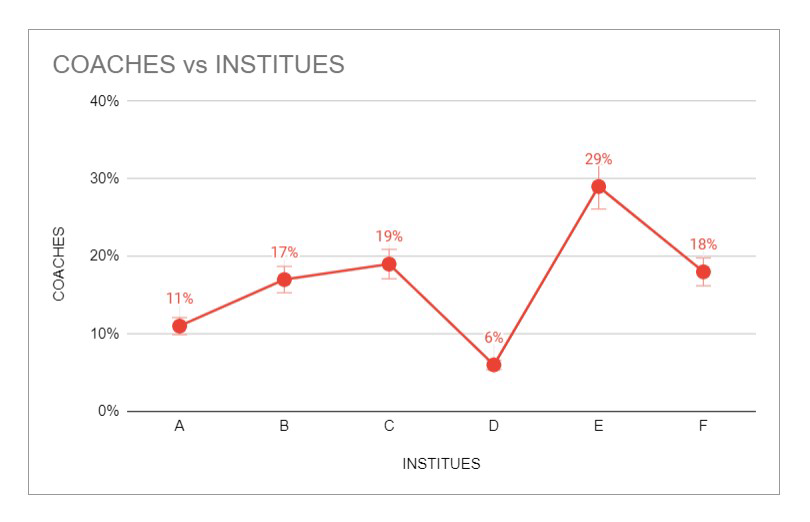
Q106 The pie chart displays the Percentage Wise distribution of sports coaches in six different institutes. If the total number of sports coaches is 6400 then answer the following-
The number of sports coaches in Institute B is approximately what percent of the total number of sports coaches in Institute D and Institute E together?
33.45%
27.85%
48.57%
23.87%
Q107
Q107 The pie chart displays the Percentage Wise distribution of sports coaches in six different institutes. If the total number of sports coaches is 6400 then answer the following-
Suppose twenty five percent of the coaches in Institute C are females then the number of male coaches in Institute C are?
846
912
764
812
Q108
Q108 The pie chart displays the Percentage Wise distribution of sports coaches in six different institutes. If the total number of sports coaches is 6400 then answer the following-
The difference between the total number of sports coaches in Institutes A, B and C together and the total number of coaches in Institutes D, E and F together is exactly equal to the number of coaches of which Institute?
A
C
E
None of these
Q109
Q109 The given pie chart displays the Percentage Wise distribution of sports coaches in six different institutes. If the total number of sports coaches is 6400 then answer the following-
Suppose one-thirty sixth of the coaches from Institute F have the salary of 96000 each then what will be the total salary of all the coaches together from Institute F?
30.72 lakh
28.65 lakh
32.80 lakh
36.25 lakh
Q110
Q110 The pie chart displays the Percentage Wise distribution of sports coaches in six different institutes. If the total number of sports coaches is 6400 then answer the following-
What is the average number of coaches in Institute A, C, D and F together?
786
832
864
916
