
 Placement Preparation
an HCL GUVI product

Q191
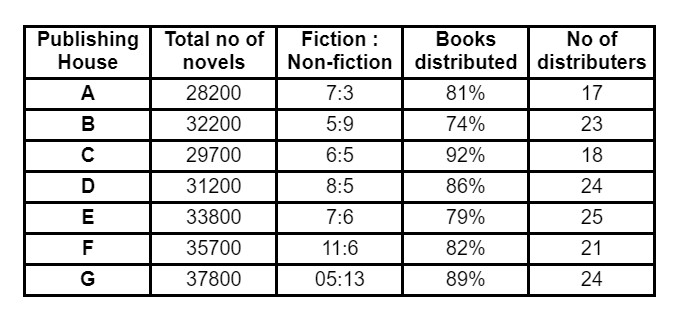
Q191 Study the given table carefully which shows the data of fiction and non-fiction novels published by seven different publishing houses and answer the following question-
What is the difference between the number of Fiction novels published by publishing houses A and B?
7230
8240
8180
7860
Q192
Q192 Study the given table carefully which shows the data of fiction and non-fiction novels published by seven different publishing houses and answer the following question-
What is the average number of non fiction novels published by publishing houses F and G?
19950
18820
18340
19620
Q193
Q193 Study the given table carefully which shows the data of fiction and non-fiction novels published by seven different publishing houses and answer the following question-
If each distributor gets the equal number of novels then approximately how many novels were given to each distributor of publishing house E?
1124
1218
1236
1068
Q194
Q194 Study the given table carefully which shows the data of fiction and non-fiction novels published by seven different publishing houses and answer the following question-
If the novels published by houses D, E and F are increased by 30% and the novels published by remaining publishing houses are decreased by 20% then what is the approximate average number of novels published by all the houses?
29876
37684
33319
32347
Q195
Q195 Study the given table carefully which shows the data of fiction and non-fiction novels published by seven different publishing houses and answer the following question-
What is the total number of fiction novels published by publishing houses D and E?
32800
37400
28800
29400
Q196
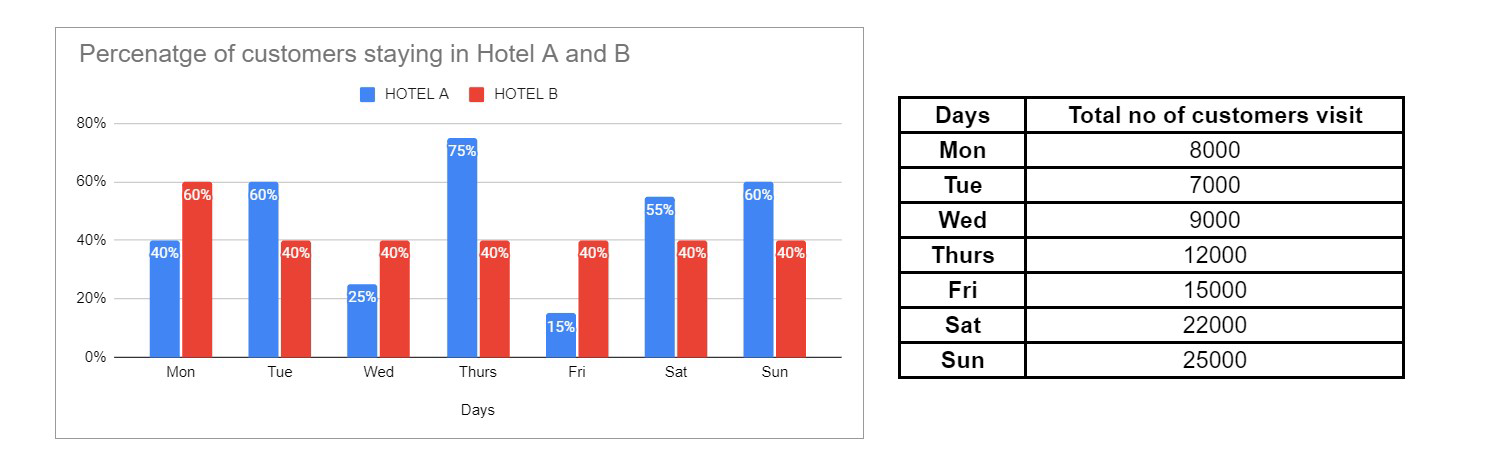
Q196 The given chart shows the percentage of customers staying in Hotel A and B everyday and the table shows the total number of customers visiting to stay in the hotel on different days of a week. Study the data carefully and answer the question below-
Customers staying in hotel A on monday and saturday together is what percentage of customers visiting hotel B on saturday?
154.54%
163.37%
183.33%
172%
Q197
Q197 The given chart shows the percentage of customers staying in Hotel A and B everyday and the table shows the total number of customers visiting to stay in the hotel on different days of a week. Study the data carefully and answer the question below-
Average number of customers staying in hotel A during the whole week is approximately what percent more or less than the average number of customers staying in hotel B?
3.28% more
2.63% less
4.43 % more
4.17% less
Q198
Q198 The given chart shows the percentage of customers staying in Hotel A and B everyday and the table shows the total number of customers visiting to stay in the hotel on different days of a week. Study the data carefully and answer the question below-
On which day of the week, the customers staying in hotel A were minimum?
Monday
Wednesday and Friday
Wednesday and Tuesday
Tuesday and Friday
Q199
Q199 The given chart shows the percentage of customers staying in Hotel A and B everyday and the table shows the total number of customers visiting to stay in the hotel on different days of a week. Study the data carefully and answer the question below-
What is the ratio of customers staying in hotel A on monday and thursday together to the customers staying in hotel B on wednesday and monday together?
1.06:1
1.13:1
1.23:1
1.37:1
Q200
Q200 The given chart shows the percentage of customers staying in Hotel A and B everyday and the table shows the total number of customers visiting to stay in the hotel on different days of a week. Study the data carefully and answer the question below-
On which day of the week, the customers staying in hotel B were minimum?
Wednesday
Thursday
Tuesday
None of these
