
 Placement Preparation
an HCL GUVI product

Q1
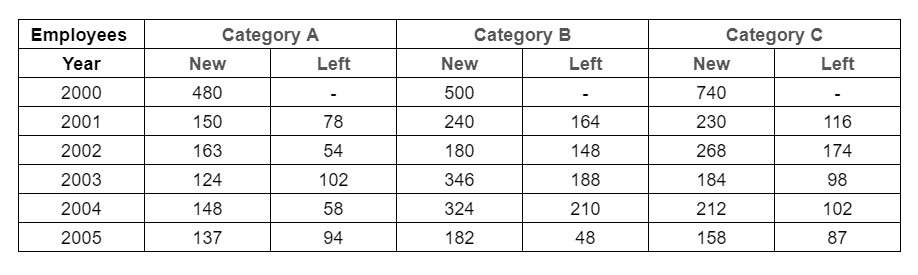
Q1 The following table shows the data of different categories of employees of an organisation.
What was the total number of category A,B and C employees working in the company in the year 2003?
2483
2384
3284
3824
Q2
Q2 The following table shows the data of different categories of employees of an organisation.
For which of the following categories the percentage increase in the number of employees working in the Company from 2000 to 2001 was the minimum and how much?
B 14%
A 12%
A15%
C15.2%
Q3
Q3 The following table shows the data of different categories of employees of an organisation.
Find the average number of category C employees who left from 2000 to 2005?
121.7
115.4
117.3
124.0
Q4
Q4 The following table shows the data of different categories of employees of an organisation.
Which of the categories will have the maximum number of employees in 2005 and how many?
A 816
A 1248
B 1428
C 1215
Q5
Q5 The following table shows the data of different categories of employees of an organisation.
Find the average number of all category employees working in the organisation in the year 2002?
739
793
849
786
Q6
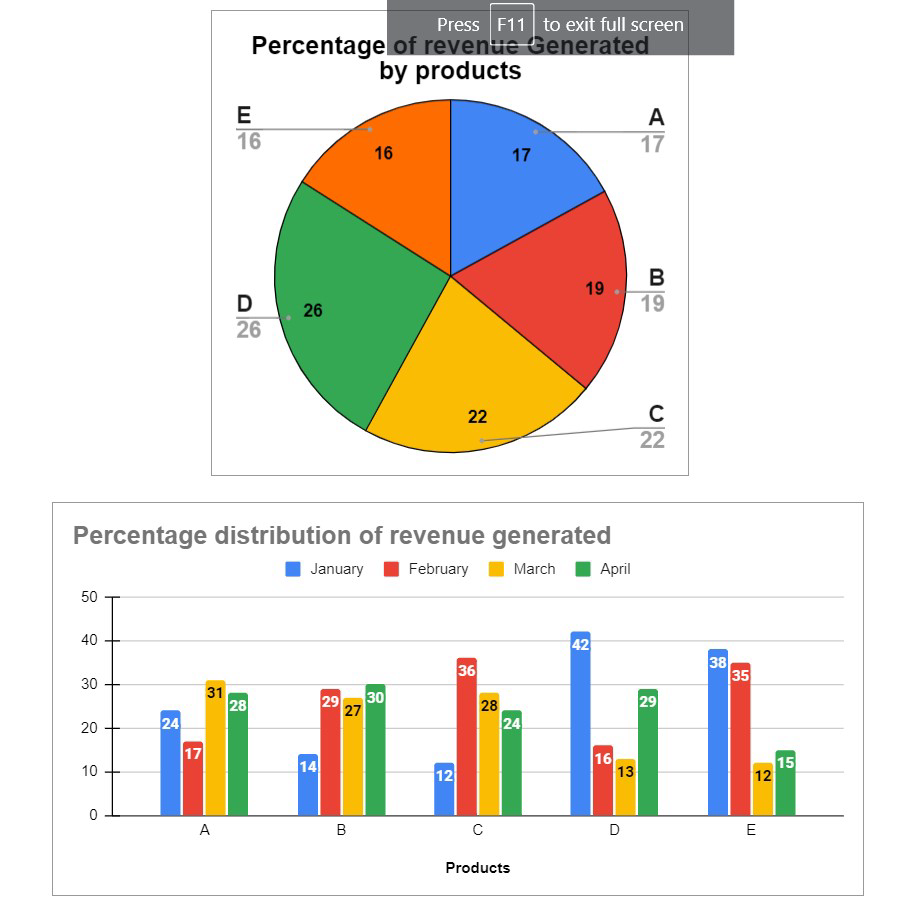
Q6 The given chart shows the data of revenue generated by a sales company for five different products. The company generated total revenue of 40 lakhs in the first four months.
Which product produces the maximum revenue in the month of April and how much?
A 1.941lakhs
D 3.016 lakhs
B 3.214lakhs
E 2.817
Q7
Q7 The given chart shows the data of revenue generated by a sales company for five different products. The company generated total revenue of 40 lakhs in the first four months.
Which product produces the minimum revenue in the month of January and how much?
A 1.632lakhs
E 2.432 lakhs
D 0.98 lakhs
C 1.056 lakhs
Q8
Q8 The given chart shows the data of revenue generated by a sales company for five different products. The company generated total revenue of 40 lakhs in the first four months.
What is the monthly average revenue produced by product E from January to April?
2.4 lakhs
6.1 lakhs
1.6 lakhs
1.8 lakhs
Q9
Q9 The given chart shows the data of revenue generated by a sales company for five different products. The company generated total revenue of 40 lakhs in the first four months.
What is the total revenue produced by products C and D in March and April?
8.944 lakhs
7.928 lakhs
6.898 lakhs
None of the above
Q10
Q10 The given chart shows the data of revenue generated by a sales company for five different products. The company generated total revenue of 40 lakhs in the first four months.
What amount of revenue was generated by product C in March?
3.248 lakhs
2.464 lakhs
3.824 lakhs
None of the above

Practice Tabulation Questions & Answers
To better their understanding of tabulation concepts and enhance their ability to answer questions quickly and accurately, candidates should engage in regular practice of tabulation questions.
Importance: Medium
Difficulty level: 1 out of 5 (Easy)
Examination- SSC, Banking, GMAT, GRE, SAT, CAT, etc.
Parent section: Data Interpretation
Why Choose Our Platform for Practicing Tabulation Questions?
The following are the reasons to choose our platform for practicing the tabulation questions:
1. One Stop Solution
With our platform, students can fully comprehend the tabulation topic by practicing questions in addition to learning tabulation formulas, concepts, tips, and shortcuts.
2. User Interface
Students can practice tabulation questions in an effortless way using our platform. We provide an explanation, a forum to discuss your doubts, and a variety of other features.
3. Curated by Experts
Our industry experts and teachers have simplified complex tabulation concepts and equations into easy-to-understand bytes for students. Students can easily understand the concepts and apply their knowledge by practicing problems.
4. Regularly Updated
We keep a close eye on the latest competitive examination patterns and follow the most up-to-date syllabus, so the tabulation practice questions are regularly revised.
5. Completely Free
We encourage students to be entirely focused on their tabulation topic preparation. Therefore we don't charge any fees, and the entire platform is free to use. Students can practice data interpretation questions completely free.
6. Wide Array of Problem Categories
We cover all types of tabulation questions, ensuring comprehensive preparation for students. Just by practicing on our platform, students can be confident about cracking the data interpretation questions in placement exams.