
 Placement Preparation
an HCL GUVI product

Q71
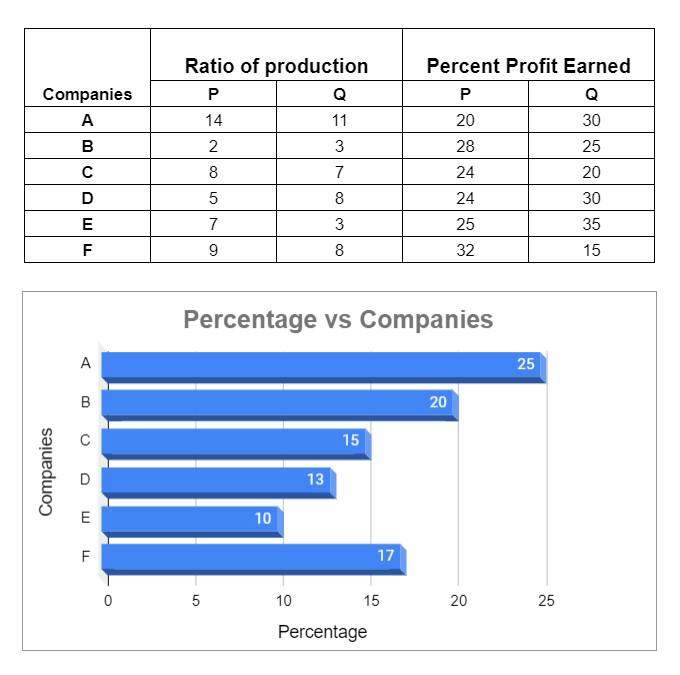
Q71 The percentage distribution of commodities produced (P and Q ) by six companies is given in the pie chart. The total production cost (of both commodities) of all companies together is 24 crores. The ratio of commodities P and Q produced and percentage profit earned on these commodities is given by the table.
The total cost of production of commodity Q produced by companies E and F together will be?
1.78 crore
2.4 crore
2.24crore
2.64 crore
Q72
Q72 The percentage distribution of commodities produced (P and Q ) by six companies is given in the pie chart. The total production cost (of both commodities) of all companies together is 24 crores. The ratio of commodities P and Q produced and percentage profit earned on these commodities is given by the table.
The difference between the cost of production of commodity P by Company B and the cost of production of commodity Q by company C will be equal to?
0.72 crore
1.2 crore
0.24 crore
0.48 crore
Q73
Q73 The percentage distribution of commodities produced (P and Q ) by six companies is given in the pie chart. The total production cost (of both commodities) of all companies together is 24 crores. The ratio of commodities P and Q produced and percentage profit earned on these commodities is given by the table.
The total amount of profit earned by Company A on both commodities P and Q together will be?
1.616 crore
1.464 crore
1.72 crore
1.56 crore
Q74
Q74 The percentage distribution of commodities produced (P and Q ) by six companies is given in the pie chart. The total production cost (of both commodities) of all companies together is 24 crores. The ratio of commodities P and Q produced and percentage profit earned on these commodities is given by the table.
What is the amount of profit earned on commodity Q by Company B and D together?
1.296 crore
1.648 crore
1.348 crore
1.72 crore
Q75
Q75 The percentage distribution of commodities produced (P and Q ) by six companies is given in the pie chart. The total production cost (of both commodities) of all companies together is 24 crores. The ratio of commodities P and Q produced and percentage profit earned on these commodities is given by the table.
The ratio of the profit earned by Company A to that earned by Company E on commodity P will be?
1.212 crore
1.468 crore
1.325 crore
1.092 crore
Q76
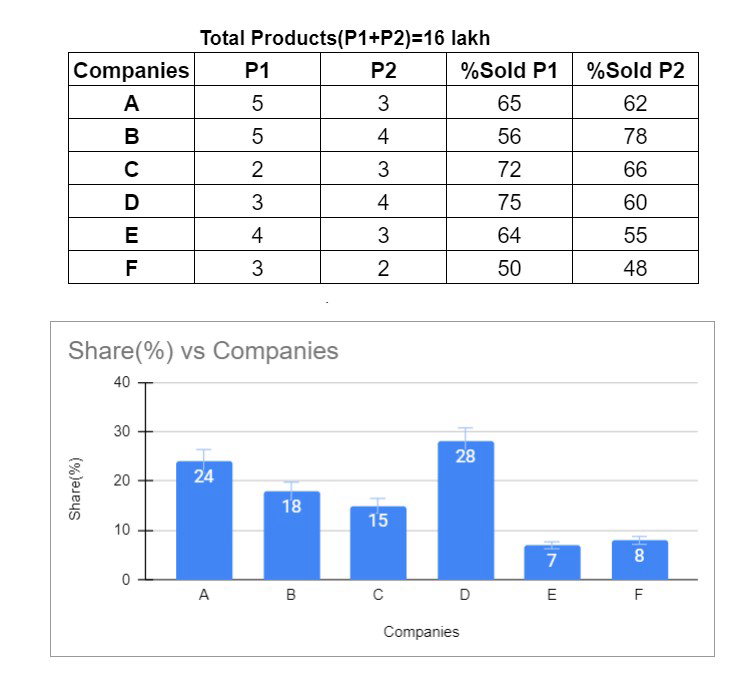
Q76 The percentage distribution of total products (P1 and P2 ) produced by six companies (A, B, C, D, E, and F) is given by pie-chart. The table shows the ratio of P1 to P2 and the percentage of the sale of P1 and P2.
The difference between the total products produced by Company A and B together and the total products produced by Company D is?
2.48 lakh
2.24 lakh
2.16 lakh
2.65 lakh
Q77
Q77 The percentage distribution of total products (P1 and P2 ) produced by six companies (A, B, C, D, E, and F) is given by pie-chart. The table shows the ratio of P1 to P2 and the percentage of the sale of P1 and P2.
The difference between the total number of P1 products and the total number of P2 products produced by Company F will be?
0.256 lakh
0.212 lakh
0.236 lakh
0.312 lakh
Q78
Q78 The percentage distribution of total products (P1 and P2 ) produced by six companies (A, B, C, D, E, and F) is given by pie-chart. The table shows the ratio of P1 to P2 and the percentage of the sale of P1 and P2.
The average number of P1 products sold by all six companies together is?
79600
83240
89680
88440
Q79
Q79 The percentage distribution of total products (P1 and P2 ) produced by six companies (A, B, C, D, E, and F) is given by pie-chart. The table shows the ratio of P1 to P2 and the percentage of the sale of P1 and P2.
The difference between the number of P1 products sold and the number of P2 products sold by Company E is?
1660
14560
16840
18200
Q80
Q80 The percentage distribution of total products (P1 and P2 ) produced by six companies (A, B, C, D, E, and F) is given by pie-chart. The table shows the ratio of P1 to P2 and the percentage of the sale of P1 and P2.
The number of P1 products sold by Company A is what percentage of the number of P1 products sold by Company F?
40.625
38.54%
120.25%
None of the above
