
 Placement Preparation
an HCL GUVI product

Q11
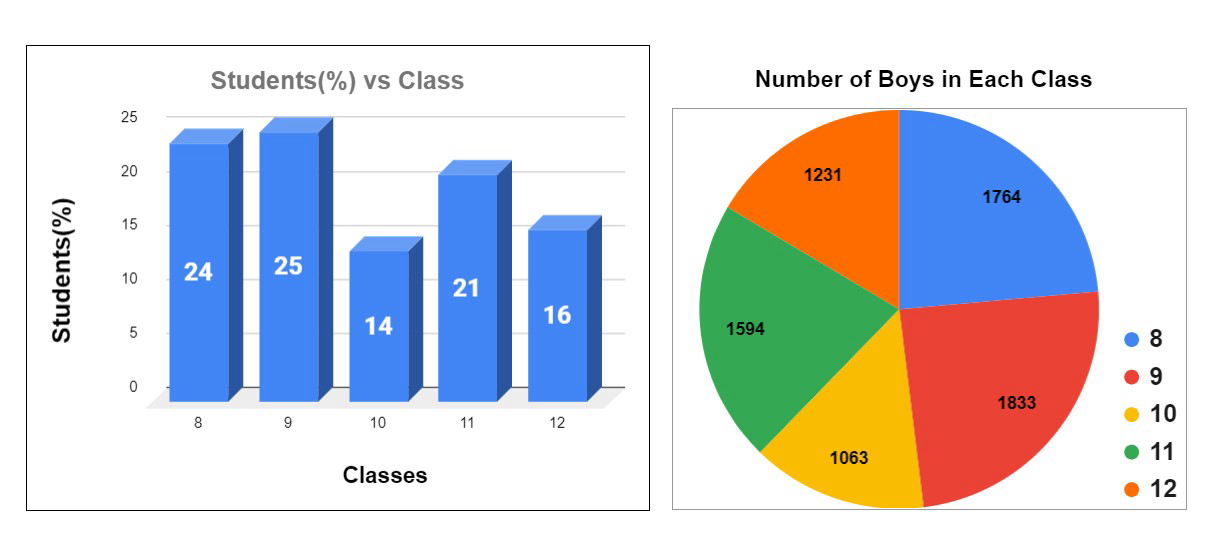
Q11 The percentage distribution of students in different classes are shown. There are a total of 15,600 students in the school.
What is the number of girls in Classes 9 and 11 together?
2432
2138
2067
2762
Q12
Q12 The percentage distribution of students in different classes are shown. There are a total of 15,600 students in the school.
What is the ratio of the number of boys to the number of girls in classes 11 and 12?
1.012
0.994
1.147
0.958
Q13
Q13 The percentage distribution of students in different classes are shown. There are a total of 15,600 students in the school.
What is the percentage of girls in classes 8,9 and 10 over the total number of students in the school?
33.13%
39.24%
29.88%
32.02%
Q14
Q14 The percentage distribution of students in different classes are shown. There are a total of 15,600 students in the school.
What is the average number of boys in each class?
1512
1497
1624
None of the above
Q15
Q15 The percentage distribution of students in different classes are shown. There are a total of 15,600 students in the school.
What is the number of boys that should be added in class 10 so that there are equal numbers of boys and girls in that class?
63
49
71
58
Q16
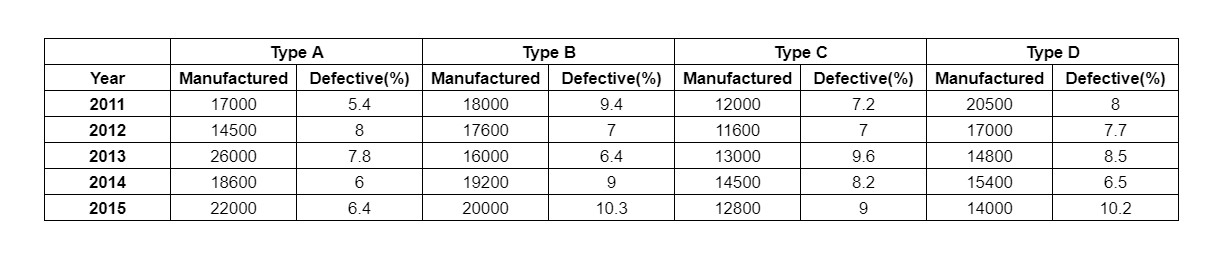
Q16 The following table shows the data of a laptop company from 2011 to 2015. The data includes the number of laptops manufactured and the percentage of defective laptops of four different types.
In which year did the 3rd maximum defective laptops of type C were produced?
2012
2011
2015
2014
Q17
Q17 The following table shows the data of a laptop company from 2011 to 2015. The data includes the number of laptops manufactured and the percentage of defective laptops of four different types.
What is the average number of defective type D laptops manufactured per year?
1048.6
1327.2
1116.8
1278.0
Q18
Q18 The following table shows the data of a laptop company from 2011 to 2015. The data includes the number of laptops manufactured and the percentage of defective laptops of four different types.
What is the number of non defective typeA laptops produced in 2012?
13340
14330
13430
None of the above
Q19
Q19 The following table shows the data of a laptop company from 2011 to 2015. The data includes the number of laptops manufactured and the percentage of defective laptops of four different types.
In which year did the minimum number of type B defective laptops were manufactured?
2015
2014
2011
2013
Q20
Q20 The following table shows the data of a laptop company from 2011 to 2015. The data includes the number of laptops manufactured and the percentage of defective laptops of four different types.
What is the total number of defective laptops manufactured in the year 2015?
6218
6048
7286
7862
