
 Placement Preparation
an HCL GUVI product

Q31
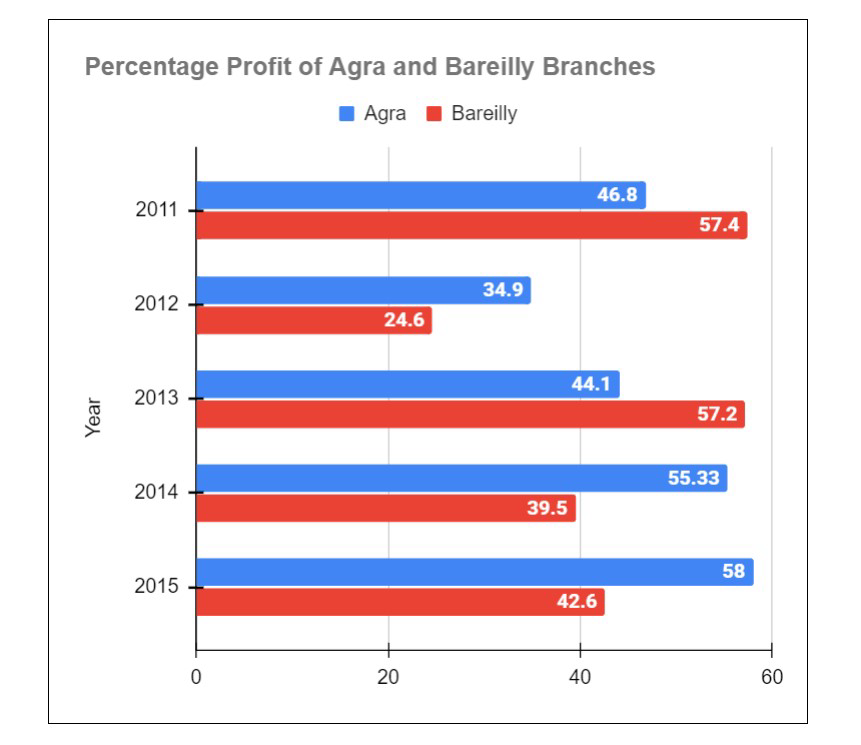
Q31 The given chart shows the percentage profit of two different branches of a company in Agra and Bareilly for the years 2011-2015.
If the profit of Agra branch is 29 lakhs in 2012 then what is the amount of profit of the same branch in 2014 if the expenditure was double the amount of expenditure in 2012?
78.63 lakhs
88.55 lakhs
91.95 lakhs
82.84 lakhs
Q32
Q32 The given chart shows the percentage profit of two different branches of a company in Agra and Bareilly for the years 2011-2015.
If the ratio of Incomes of Agra and Bareilly branches in 2014 is 7:3 then what is the ratio of their expenditures in the same year?
2.09:1
2.23:1
1.83:1
1.33:1
Q33
Q33 The given chart shows the percentage profit of two different branches of a company in Agra and Bareilly for the years 2011-2015.
If the income in the year 2011 in Bareilly branch was 35 lakhs then what is the amount of expenditure in that year in the same branch?
24.78 lakhs
32.41 lakhs
27.86 lakhs
22.23 lakhs
Q34
Q34 The given chart shows the percentage profit of two different branches of a company in Agra and Bareilly for the years 2011-2015.
If the expenditures of Agra and Bareilly branch in 2015 were 48 lakhs and 34 lakhs respectively. What is the total income of the two branches in 2015?
132.67 lakhs
124.324 lakhs
128.762 lakhs
127.865 lakhs
Q35
Q35 The given chart shows the percentage profit of two different branches of a company in Agra and Bareilly for the years 2011-2015.
What is the average profit percentage of Bareilly branch per year?
44.26%
34.58%
41.67%
45.56%
Q36
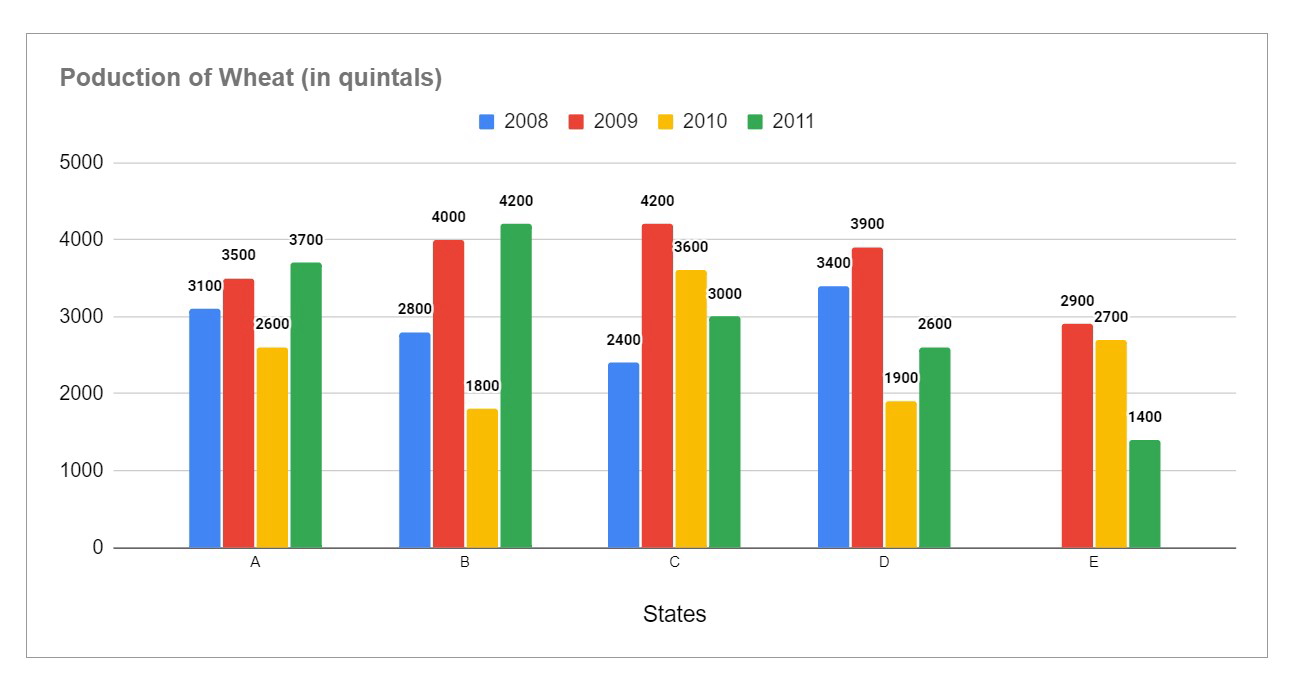
Q36 The given chart shows the production of wheat of five different states in India of the years 2008-2011.
What is the average quantity of wheat produced (in quintals) per year?
2935
3178
3225
3476
Q37
Q37 The given chart shows the production of wheat of five different states in India of the years 2008-2011.
What was the average production of wheat by all five states in 2011?
2870
2980
3110
2985
Q38
Q38 The given chart shows the production of wheat of five different states in India of the years 2008-2011.
If the production of wheat for state C is increased by 20%and 25% for the years 2008 and 2009 respectively then what will be the total quantity of wheat produced in both these years?
32480
42600
41750
35730
Q39
Q39 The given chart shows the production of wheat of five different states in India of the years 2008-2011.
What percentage of total wheat production of state E needs to be increased so that production of wheat for states B and E are the same for the years 2008-2011?
16.36%
15.40%
17.33%
18.67%
Q40
Q40 The given chart shows the production of wheat of five different states in India of the years 2008-2011.
If the production of wheat of state D was increased by 30% in 2011 then what will be the ratio of wheat produced in state D to the wheat produced in state E in 2010?
!.33:1
1.67:1
1.25:1
1.45:1
