
 Placement Preparation
an HCL GUVI product

Q111
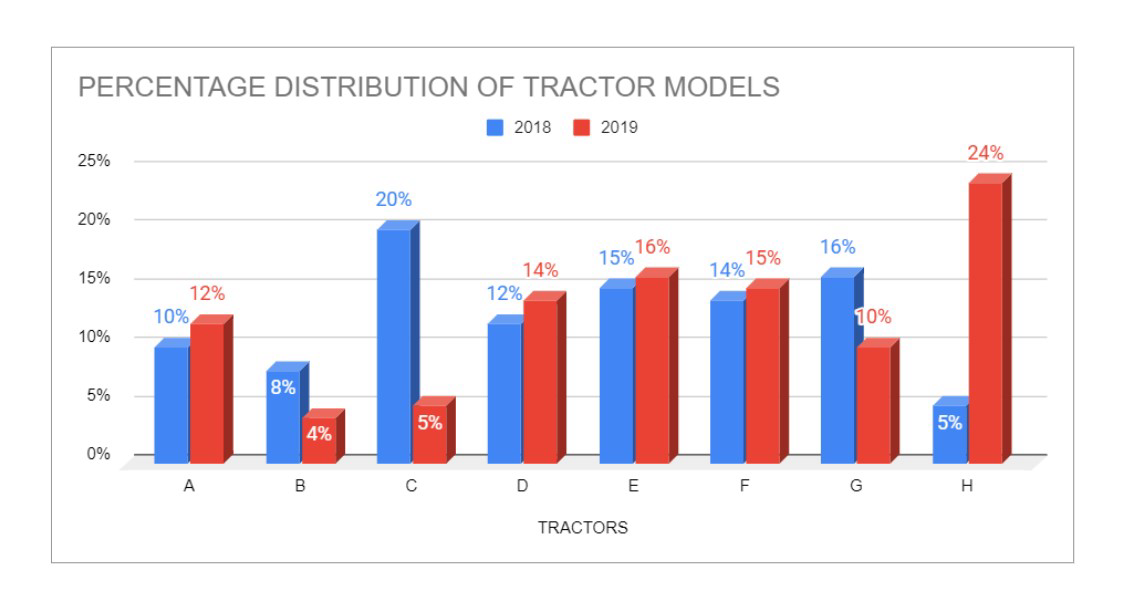
Q111 The given figure displays the distribution of the number of tractors of different models produced by a tractor manufacturing company in 2018 and 2019. Total number of tractors produced in 2018 and 2019 are 32000 and 60000 respectively.
What is the average number by tractors of Model D, E and F manufactured in the year 2018?
5425.75
4373.33
4281.33
4467.67
Q112
Q112 The given figure displays the distribution of the number of tractors of different models produced by a tractor manufacturing company in 2018 and 2019. Total number of tractors produced in 2018 and 2019 are 32000 and 60000 respectively.
What is the percentage increase in the number of tractors of model A manufactured by the company the year 2018 to 2019?
100%
125%
150%
133%
Q113
Q113 The given figure displays the distribution of the number of tractors of different models produced by a tractor manufacturing company in 2018 and 2019. Total number of tractors produced in 2018 and 2019 are 32000 and 60000 respectively.
The ratio of the number of tractors of model F manufactured in the year 2018 to the number of tractors of model H manufactured in the year 2019 is?
37.63%
28.57%
44.23%
53.73%
Q114
Q114 The given figure displays the distribution of the number of tractors of different models produced by a tractor manufacturing company in 2018 and 2019. Total number of tractors produced in 2018 and 2019 are 32000 and 60000 respectively.
The number of tractors of Model D manufactured in the year 2019 is what percent of the number of Model C tractors in the year 2018?
127.83%
144.64%
125.75%
131.25%
Q115
Q115 The given figure displays the distribution of the number of tractors of different models produ)ced by a tractor manufacturing company in 2018 and 2019. Total number of tractors produced in 2018 and 2019 are 32000 and 60000 respectively.
The number of tractors of Model G manufactured in the year 2019 is approximately what percentage more than the number of same-model tractors manufactured in 2018?
33.76%
38.87%
44.23%
51.75%
Q116
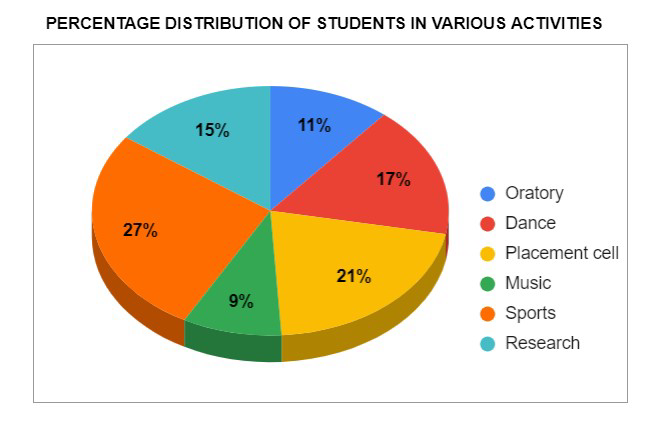
Q116 The pie chart displays the percentage wise distribution of students involved in different activities in college. If the total number of students is 12600 then answer the following-
The number of students involved in the Sports is approximately what percent more than the number of students involved in Placement cell?
21.33%
28.47%
32.45%
23.58%
Q117
Q117 The pie chart displays the percentage wise distribution of students involved in different activities in college. If the total number of students is 12600 then answer the following-
Suppose 30 percent of the number of students involved in the Research activity are females, then what is the number of male students involved in the Research activity?
1172
1258
1323
1437
Q118
Q118 The pie chart displays the percentage wise distribution of students involved in different activities in college. If the total number of students is 12600 then answer the following-
The number of students involved in Placement cell activity is approximately what percentage of the total number of students involved in the activity of Oratory and Sports activities together?
55.26%
44.37%
67.33%
47.49%
Q119
Q119 The pie chart displays the percentage wise distribution of students involved in different activities in college. If the total number of students is 12600 then answer the following-
What is the average number of students involved in Dance, Music and Research activities together?
1584
1722
1676
1391
Q120
Q120 The pie chart displays the percentage wise distribution of students involved in different activities in college. If the total number of students is 12600 then answer the following-
What is the difference between the total number of students involved in the activity of Oratory and Music together and the total number of students involved in Dance and Placement cell activities together?
2268
2745
3174
2492
