
 Placement Preparation
an HCL GUVI product

Q61
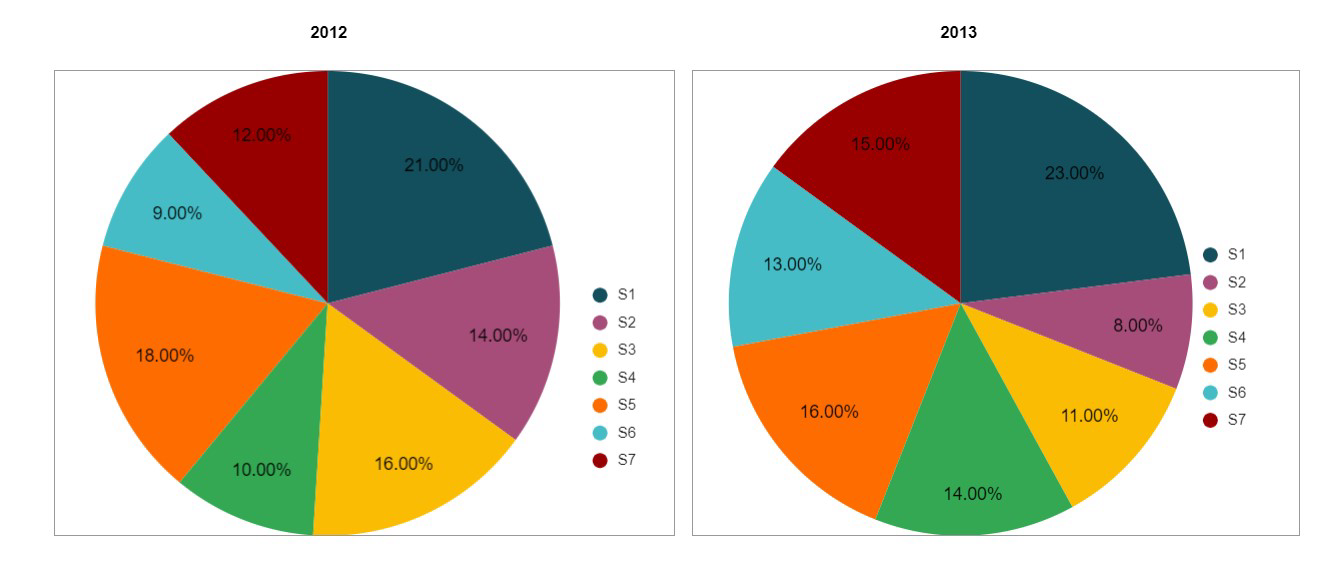
Q61 The total number of candidates selected in a medical entrance exam from seven different schools in 2012 and 2013 is given in the pie charts. (The total number of candidates chosen from school S7 in 2012 and 2013 are 180 and 270, respectively).
The total number of candidates selected from all seven schools together in 2013 is what percent of that from all seven schools in 2012?
115%
85%
90%
120%
Q62
Q62 The total number of candidates selected in a medical entrance exam from seven different schools in 2012 and 2013 is given in the pie charts. (The total number of candidates chosen from school S7 in 2012 and 2013 are 180 and 270, respectively.) The percentage rise in the number of candidates selected from School S4 from 2012 to 2013 is?
63%
68%
72%
None of the above
Q63
Q63 The total number of candidates selected in a medical entrance exam from seven different schools in 2012 and 2013 is given in the pie charts. (The total number of candidates chosen from school S7 in 2012 and 2013 are 180 and 270, respectively.) Find out the total number of candidates selected from School S5 and S7 together in 2012 is what percent of the number of candidates chosen from School S2 in 2013?
312.5%
325%
285%
210.5%%
Q64
Q64 The total number of candidates selected in a medical entrance exam from seven different schools in 2012 and 2013 is given in the pie charts. (The total number of candidates chosen from school S7 in 2012 and 2013 are 180 and 270, respectively.) What are the difference between the average number of candidates selected from schools S1, S2, and S3 in 2012 and the average number of candidates selected from schools S5, S6, and S7 in 2013?
7
5
9
6
Q65
Q65 The total number of candidates selected in a medical entrance exam from seven different schools in 2012 and 2013 is given in the pie charts. (The total number of candidates chosen from school S7 in 2012 and 2013 are 180 and 270, respectively.) Which of the following schools is the percent rise or fall in the number of candidates selected from 2012 to 2013 the maximum?
S5
S6
S4
S3
Q66
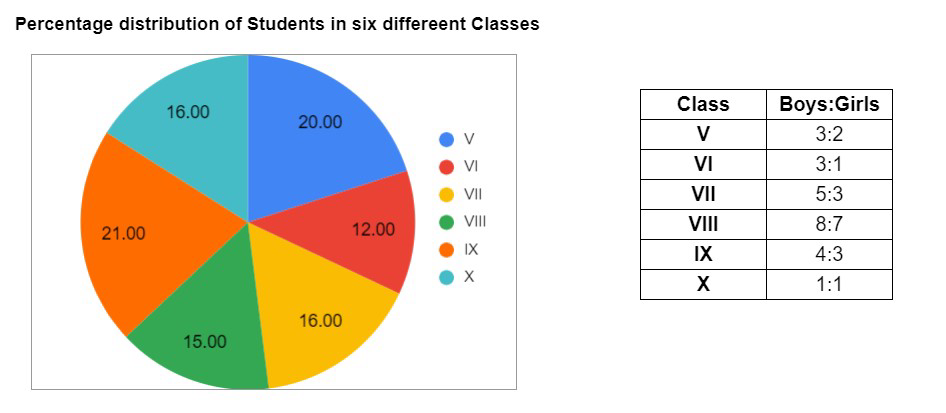
Q66 The pie - chart gives the distribution of students in a school. The ratio of the number of boys to the number of girls in the school is demonstrated in the table. Total number of students studying in six different classes of the school is 1200.
The average of the number of girls studying in all six classes is ?
91
76
84
82
Q67
Q67 The pie - chart gives the distribution of students in a school. The ratio of the number of boys to the number of girls in the school is demonstrated in the table. Total number of students studying in six different classes of the school is 1200.
What is the difference between the total number of boys and the total number of girls in all six classes together?
216
224
248
196
Q68
Q68 The pie - chart gives the distribution of students in a school. The ratio of the number of boys to the number of girls in the school is demonstrated in the table. Total number of students studying in six different classes of the school is 1200.
In the given pairs of classes, which two classes have an equal number of boys in them?
VI and VIII
V and VII
VIII and X
None of the above
Q69
Q69 The pie - chart gives the distribution of students in a school. The ratio of the number of boys to the number of girls in the school is demonstrated in the table. Total number of students studying in six different classes of the school is 1200.
The difference between the number of boys and the number of girls in class V is what percentage of the difference between the number of boys and the number of girls in class VII?
84%
100%
96%
82%
Q70
Q70 The pie - chart gives the distribution of students in a school. The ratio of the number of boys to the number of girls in the school is demonstrated in the table. Total number of students studying in six different classes of the school is 1200.
The total number of boys in class VI is what percentage more than the total number of girls in class X?
12.5%
17%
21.5%
16%
