
 Placement Preparation
an HCL GUVI product

Q51
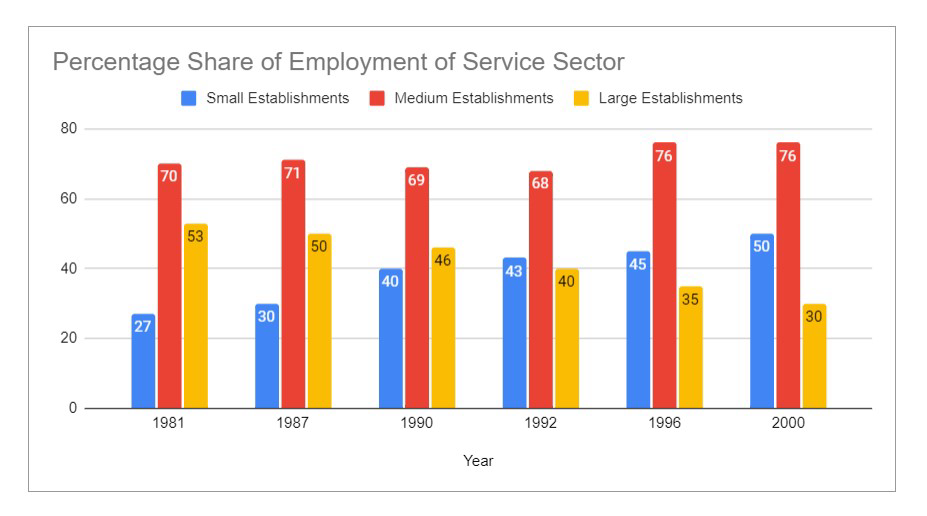
Q51 The table here provides the percentage share of the service sector in small, medium, and large establishments individually. Small establishments contain less than 100 workers, medium establishments have 100 to 1500, while large establishments manage more than 1500 workers.
In all fifty million and sixty million people worked in small establishments in 1981 and 1987. The difference between the no. of employees working in service sector small establishments in 1981 and 1987 is?
4.5 million
5.2 million
6.8 million
None of the above
Q52
Q52 The table here provides the percentage share of the service sector in small, medium, and large establishments individually. Small establishments contain less than 100 workers, medium establishments have 100 to 1500, while large establishments manage more than 1500. About 30 million employees worked in the large establishment in 1981, find out approximately how many employees worked in medium-sized establishments?
25 million
35 million
Q53
Q53 The table here provides the percentage share of the service sector in small, medium, and large establishments individually. Small establishments contain less than 100 workers, medium establishments have 100 to 1500, while large establishments manage more than 1500. About 40 million employees worked for the large establishments. In large establishments, the number of employees from 1987 to 2000 increased by 60%. Thus, employees working in the service sector in large establishments in 2000 are?
18.4 million
19.2 million
14.7 million
13.6 million
Q54
Q54 The table here provides the percentage share of the service sector in small, medium, and large establishments individually. Small establishments contain less than 100 workers, medium establishments have 100 to 1500, while large establishments manage more than 1500.
For example, suppose there were 100,000 employees in the service sector in the year 1996. Considering the number of small establishments was 750, the average number of workers employed per small establishments in the service sector is?
45
32
57
Cannot be determined
Q55
Q55 The table here provides the percentage share of the service sector in small, medium, and large establishments individually. Small establishments contain less than 100 workers, medium establishments have 100 to 1500, while large establishments manage more than 1500. Choose which of the following is/are correct?
I. Share of service sector employment in small establishments is rising steadily.
II. In large establishments, there is growing unemployment.
I and II both
II only
I only
Neither I nor II
Q56
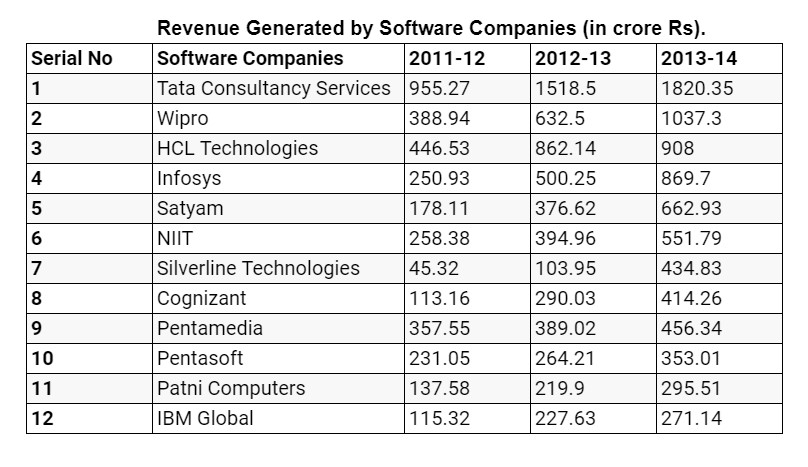
Q56 The data is given in the table about India's big 12 software exporters from 2011-2012 to 2013-2014. Consider revenue allocated is in crores.
What is the lowest growth rate of 2012-2013 to 2013-2014 for any of the companies given in the chart?
5.32%
19.88%
3.67%
17.3%
Q57
Q57 The data is given in the table about India's big 12 software exporters from 2011-2012 to 2013-2014. Consider revenue allocated is in crores.
Select the correct option about the share of exports of Tata Consultancy Services in the total exports of the 12 companies?
It has almost doubled in 2013-14 over 2011-12
It is more or less constant
It has dropped by about 5%
None of the above
Q58
Q58 The data is given in the table about India's big 12 software exporters from 2011-2012 to 2013-2014. Consider revenue allocated is in crores.
If total software exports in 2014 – 2015 were expected to be Rs 10,000 crore, while the growth of Infosys is the same as it was in 2013-2014. Which among the following will be Infosys' share of export of these 12 companies in 2014-2015?
16.4%
15.81%
17.56%
18.33%
Q59
Q59 The data is given in the table about India's big 12 software exporters from 2011-2012 to 2013-2014. Consider revenue allocated is in crores.
What is the highest growth rate of 2012-2013 to 2013-2014 for any of the companies given in the chart?
318.3%
356.5%
257.81%
425.6%
Q60
Q60 The data is given in the table about India's big 12 software exporters from 2011-2012 to 2013-2014. Consider revenue allocated is in crores.
Which company has the 3rd highest growth rate of 2012-2013 to 2013-2014 for any of the companies given in the chart?
HCL Technologies
Cognizant
Infosys
Silverline Technologies
