
 Placement Preparation
an HCL GUVI product

Q61
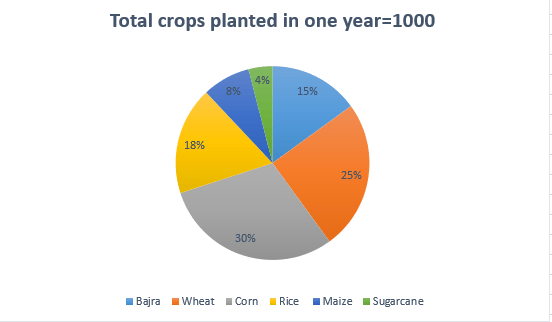
Q61 Given the information about the plantation percentage of different crops in one year. What is the ratio of percentage of Corn to the Sugarcane and then find the sum of numerator and denominator.
17
15
14
21
Q62
Q62 Given the information about the plantation percentage of different crops in one year. By how much percentage Bajra grown more than Sugarcane?
1.25%
2.25%
3.35%
2.75%
Q63
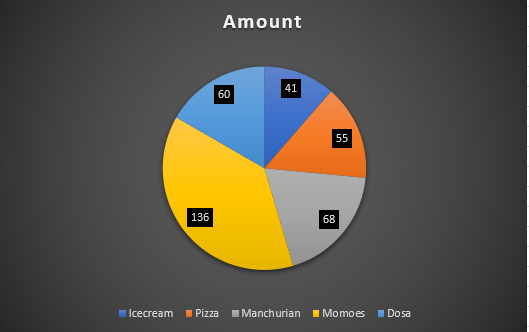
Q63 In a fate Emily started her food shop bussiness and sell different varieties of foods which is given in the pie chart. What is the percentage ratio of the amount of Pizza to Ice-cream?
173.99
185.29
150
250
Q64
Q64 In a fate Emily started her food shop bussiness and sell different varieties of foods which is given in the pie chart. What is the amount of Manchurian sold in percentage terms?
15%
18.88%
25%
27.25%
Q65
Q65 Given the information about the plantation percentage of different crops in one year. By how much percentage Wheat less than Corn?
1.25%
2.25%
3.35%
2.75%
Q66
Q66 Read the given pie chart showing the spendings of a billionaire on various types of shoes of different brands purchased in a year. Answer the following question. If the total amount spent on shoes is Rs. 50,000, the amount spent on Puma;s shoes and Reebok's shoes together was?
Rs. 12345.25
Rs. 14444
Rs. 15236.36
Rs. 14583.33
Q67
Q67 In a fate Emily started her food shop bussiness and sell different varieties of foods which is given in the pie chart. In the ice cream sector, approximately how many degrees should be there in the central angle?
150
125
185.25
147.6
Q68
Q68 In a fate Emily started her food shop bussiness and sell different varieties of foods which is given in the pie chart. What is the total degree in central angle if Manchurian, Pizza, Momoes and Dosa is taken?
1000
2546
1148.4
2563
Q69
Q69 Read the given pie chart showing the spendings of a billionaire on various types of shoes of different brands purchased in a year. Answer the following question. How much percent more is spent on Adidas's shoes than on Sparks's shoes?
11.11%
1.24%
25%
12.22%
Q70
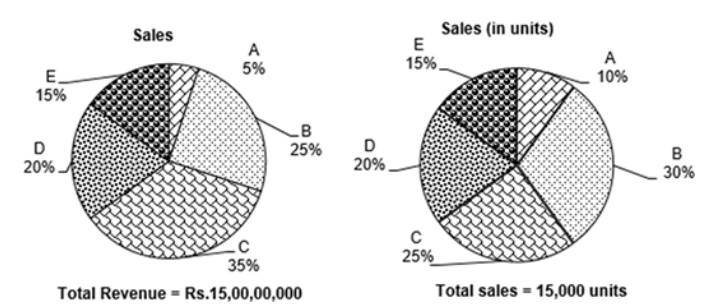
Q70 The following pie charts shows the amount of subscription generated by an house from different categories of sectors like gas subscription water any many more. What is the approximate ratio of investment in gas subscription to that of water subscription?
0.9
1.25
0.33
1
