
 Placement Preparation
an HCL GUVI product

Q51
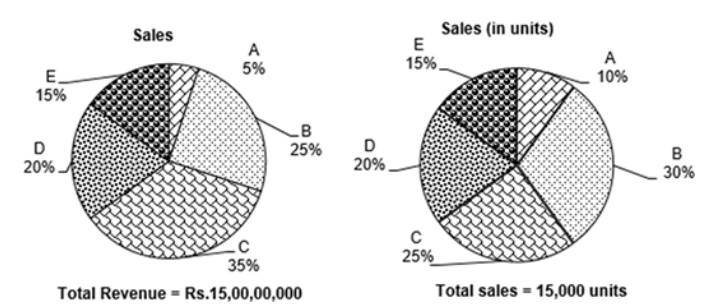
Q51 Read the given pie chart showing the spendings of a billionaire on various types of shoes of different brands purchased in a year. Answer the following question. If the total amount spent on shoes is Rs. 50,000, the amount spent on Adidas's shoes exceeds than Reebok's shoes by?
Rs. 2222.22
Rs. 1444
Rs. 1523.36
Rs. 1453.34
Q52
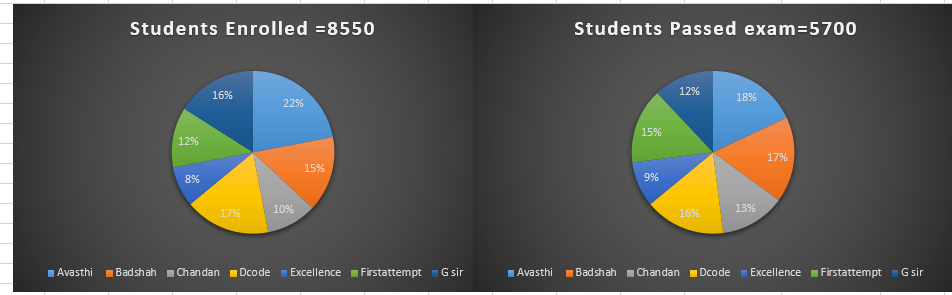
Q52 The given pie charts tells us about the distribution of students who were enrolled for NEET/ JEE Exams and the student who passed the exam in different institute. Answer the following question. What is the percentage of students passed to the students enrolled for institutes Badshah and Chandan together?
75%
25%
80%
18.88%
Q53
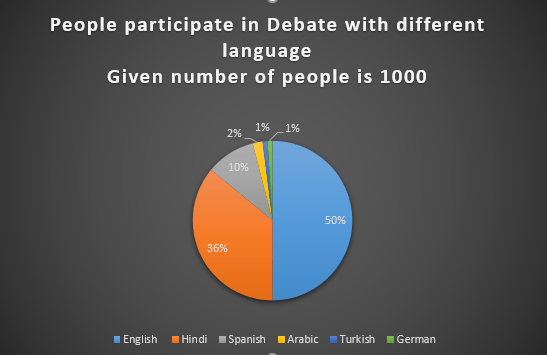
Q53 In a International debate competition, people from different nations participate and speak different language. Read the given pie chart and answer the following question. What is the difference between the angle of pie-diagram of Turkish and Spanish?
25%
27%
32.4%
20%
Q54
Q54 The given pie charts tells us about the distribution of students who were enrolled for NEET/ JEE Exams and the student who passed the exam in different institute. Answer the following question. The number of students passed from institutes Dcode and Avasthi together exceeds the number of students enrolled from institutes of Excellence and Chandan together by?
400
399
398
395
Q55
Q55 The given pie charts tells us about the distribution of students who were enrolled for NEET/ JEE Exams and the student who passed the exam in different institute. Answer the following question. Which institute has the highest perecentage of students passed to the students enrolled for the examination?
75%
25%
18%
86.67%
Q56
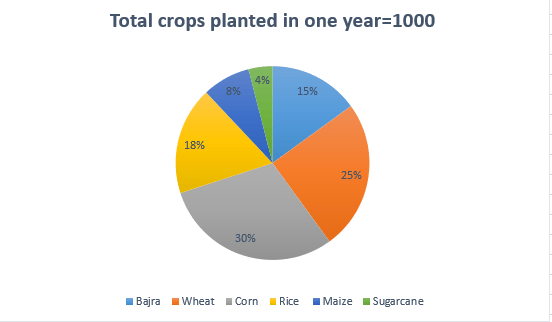
Q56 Given the information about the plantation percentage of different crops in one year. What is the ratio of plantation percentage of Wheat to Maize?
3.125
1.25
2.25
5.65
Q57
Q57 Given the information about the plantation percentage of different crops in one year. What is the plantation percentage of Wheat to Maize and Bajra together?
3.125
1.08
2.25
5.66
Q58
Q58 The given pie charts tells us about the distribution of students who were enrolled for NEET/ JEE Exams and the student who passed the exam in different institute. Answer the following question. What is the ratio of students passed to the students enrolled from institute Avasthi?
1:21
6:11
11:6
1:8
Q59
Q59 Read the given pie chart showing the spendings of a billionaire on various types of shoes of different brands purchased in a year. Answer the following question. What percentage of the total money is spent on Puma's shoes?
11.11%
21.22%
25%
12.22%
Q60
Q60 Read the given pie chart showing the spendings of a billionaire on various types of shoes of different brands purchased in a year. Answer the following question. How much percent less is spent on Puma's shoes than on Campus's shoes?
1.11%
1.24%
0.80%
0.22%
